French Canadian vs Immigrants from Bangladesh Median Earnings
COMPARE
French Canadian
Immigrants from Bangladesh
Median Earnings
Median Earnings Comparison
French Canadians
Immigrants from Bangladesh
$46,026
MEDIAN EARNINGS
36.1/ 100
METRIC RATING
190th/ 347
METRIC RANK
$45,532
MEDIAN EARNINGS
22.0/ 100
METRIC RATING
215th/ 347
METRIC RANK
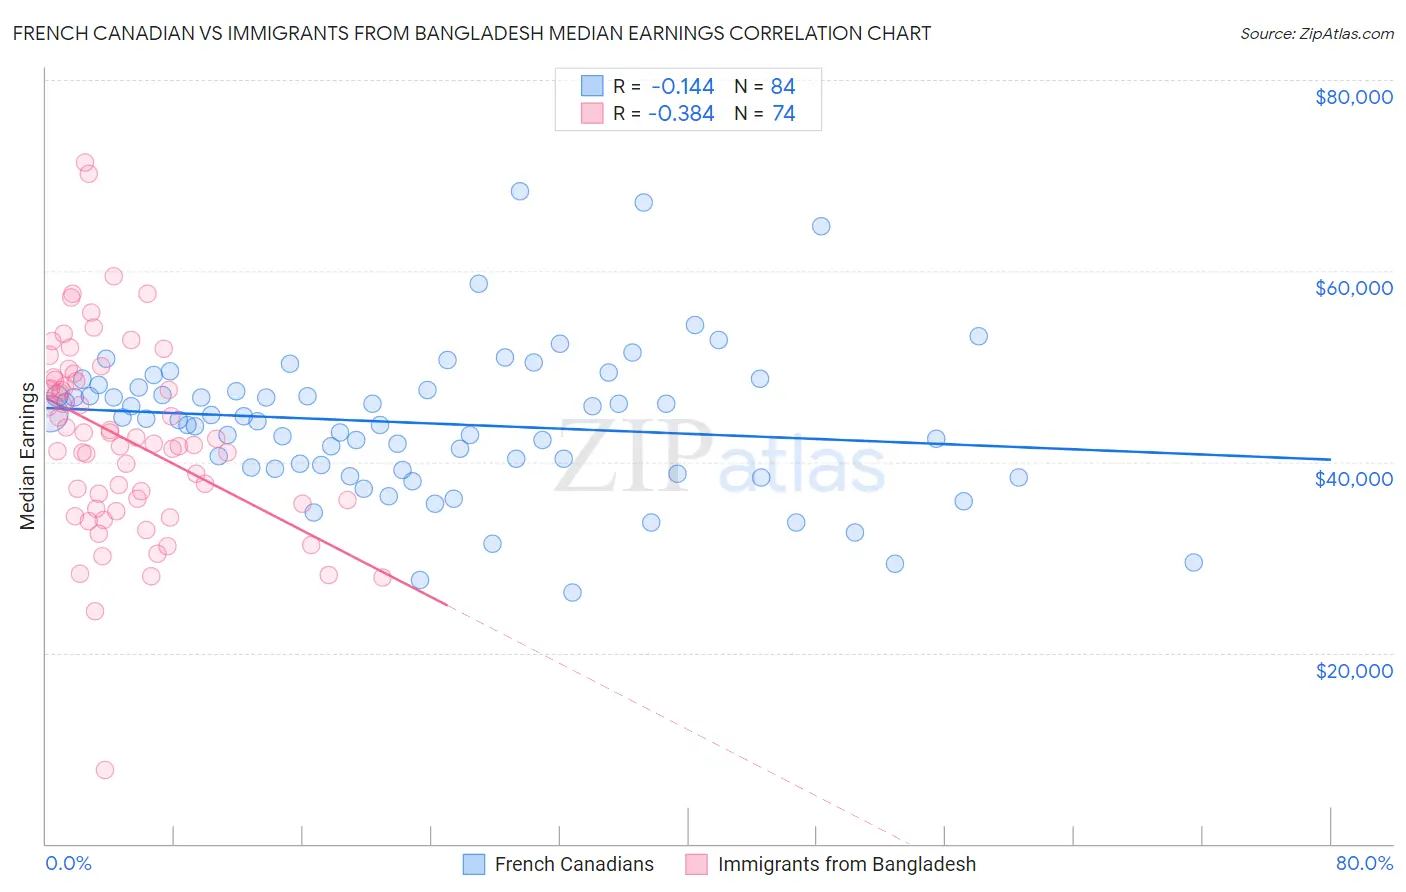
French Canadian vs Immigrants from Bangladesh Median Earnings Correlation Chart
The statistical analysis conducted on geographies consisting of 502,564,111 people shows a poor negative correlation between the proportion of French Canadians and median earnings in the United States with a correlation coefficient (R) of -0.144 and weighted average of $46,026. Similarly, the statistical analysis conducted on geographies consisting of 203,670,623 people shows a mild negative correlation between the proportion of Immigrants from Bangladesh and median earnings in the United States with a correlation coefficient (R) of -0.384 and weighted average of $45,532, a difference of 1.1%.
Median Earnings Correlation Summary
| Measurement | French Canadian | Immigrants from Bangladesh |
| Minimum | $26,346 | $7,703 |
| Maximum | $68,284 | $71,366 |
| Range | $41,938 | $63,663 |
| Mean | $44,063 | $42,517 |
| Median | $44,489 | $42,193 |
| Interquartile 25% (IQ1) | $39,382 | $35,657 |
| Interquartile 75% (IQ3) | $47,671 | $48,515 |
| Interquartile Range (IQR) | $8,289 | $12,858 |
| Standard Deviation (Sample) | $7,666 | $10,295 |
| Standard Deviation (Population) | $7,620 | $10,225 |
Similar Demographics by Median Earnings
Demographics Similar to French Canadians by Median Earnings
In terms of median earnings, the demographic groups most similar to French Canadians are Spaniard ($46,059, a difference of 0.070%), Immigrants from Armenia ($46,094, a difference of 0.15%), Finnish ($45,940, a difference of 0.19%), German ($45,935, a difference of 0.20%), and Guamanian/Chamorro ($45,933, a difference of 0.20%).
| Demographics | Rating | Rank | Median Earnings |
| French | 45.2 /100 | #183 | Average $46,296 |
| Immigrants | Kenya | 42.4 /100 | #184 | Average $46,214 |
| Uruguayans | 41.6 /100 | #185 | Average $46,190 |
| Vietnamese | 40.9 /100 | #186 | Average $46,172 |
| Iraqis | 39.9 /100 | #187 | Fair $46,140 |
| Immigrants | Armenia | 38.3 /100 | #188 | Fair $46,094 |
| Spaniards | 37.2 /100 | #189 | Fair $46,059 |
| French Canadians | 36.1 /100 | #190 | Fair $46,026 |
| Finns | 33.4 /100 | #191 | Fair $45,940 |
| Germans | 33.2 /100 | #192 | Fair $45,935 |
| Guamanians/Chamorros | 33.2 /100 | #193 | Fair $45,933 |
| Immigrants | Costa Rica | 33.0 /100 | #194 | Fair $45,928 |
| Immigrants | St. Vincent and the Grenadines | 32.4 /100 | #195 | Fair $45,908 |
| Yugoslavians | 30.5 /100 | #196 | Fair $45,846 |
| Barbadians | 30.5 /100 | #197 | Fair $45,846 |
Demographics Similar to Immigrants from Bangladesh by Median Earnings
In terms of median earnings, the demographic groups most similar to Immigrants from Bangladesh are Nigerian ($45,532, a difference of 0.0%), Immigrants from Colombia ($45,550, a difference of 0.040%), Panamanian ($45,593, a difference of 0.13%), Bermudan ($45,593, a difference of 0.13%), and Immigrants from Grenada ($45,596, a difference of 0.14%).
| Demographics | Rating | Rank | Median Earnings |
| Immigrants | Bosnia and Herzegovina | 23.7 /100 | #208 | Fair $45,600 |
| Immigrants | Thailand | 23.7 /100 | #209 | Fair $45,598 |
| Immigrants | Grenada | 23.6 /100 | #210 | Fair $45,596 |
| Panamanians | 23.5 /100 | #211 | Fair $45,593 |
| Bermudans | 23.5 /100 | #212 | Fair $45,593 |
| Immigrants | Colombia | 22.4 /100 | #213 | Fair $45,550 |
| Nigerians | 22.0 /100 | #214 | Fair $45,532 |
| Immigrants | Bangladesh | 22.0 /100 | #215 | Fair $45,532 |
| Guyanese | 20.6 /100 | #216 | Fair $45,470 |
| Tlingit-Haida | 20.5 /100 | #217 | Fair $45,468 |
| Spanish | 19.7 /100 | #218 | Poor $45,432 |
| Dutch | 18.4 /100 | #219 | Poor $45,370 |
| Ecuadorians | 15.3 /100 | #220 | Poor $45,214 |
| Immigrants | Guyana | 15.1 /100 | #221 | Poor $45,204 |
| Immigrants | Panama | 15.0 /100 | #222 | Poor $45,198 |