Czechoslovakian vs Hungarian Male Disability
COMPARE
Czechoslovakian
Hungarian
Male Disability
Male Disability Comparison
Czechoslovakians
Hungarians
12.3%
MALE DISABILITY
0.1/ 100
METRIC RATING
269th/ 347
METRIC RANK
12.0%
MALE DISABILITY
0.8/ 100
METRIC RATING
247th/ 347
METRIC RANK
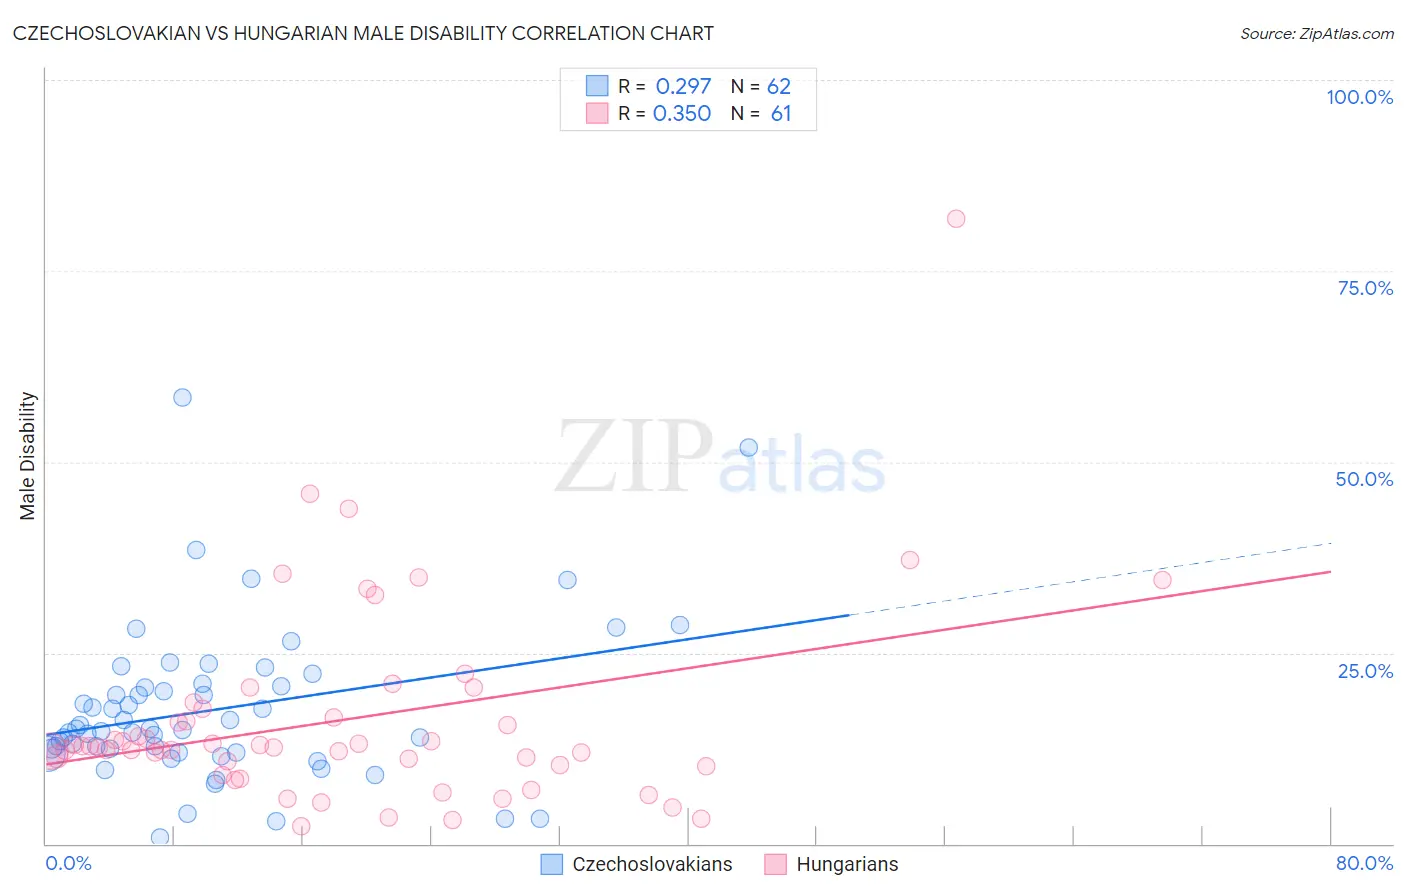
Czechoslovakian vs Hungarian Male Disability Correlation Chart
The statistical analysis conducted on geographies consisting of 368,653,122 people shows a weak positive correlation between the proportion of Czechoslovakians and percentage of males with a disability in the United States with a correlation coefficient (R) of 0.297 and weighted average of 12.3%. Similarly, the statistical analysis conducted on geographies consisting of 486,137,114 people shows a mild positive correlation between the proportion of Hungarians and percentage of males with a disability in the United States with a correlation coefficient (R) of 0.350 and weighted average of 12.0%, a difference of 2.7%.
Male Disability Correlation Summary
| Measurement | Czechoslovakian | Hungarian |
| Minimum | 0.83% | 2.3% |
| Maximum | 58.5% | 81.8% |
| Range | 57.6% | 79.5% |
| Mean | 17.5% | 16.2% |
| Median | 14.9% | 12.6% |
| Interquartile 25% (IQ1) | 12.0% | 10.2% |
| Interquartile 75% (IQ3) | 20.6% | 17.1% |
| Interquartile Range (IQR) | 8.5% | 6.9% |
| Standard Deviation (Sample) | 10.3% | 13.0% |
| Standard Deviation (Population) | 10.2% | 12.9% |
Similar Demographics by Male Disability
Demographics Similar to Czechoslovakians by Male Disability
In terms of male disability, the demographic groups most similar to Czechoslovakians are Portuguese (12.3%, a difference of 0.0%), Spaniard (12.3%, a difference of 0.080%), Immigrants from Germany (12.3%, a difference of 0.13%), Hawaiian (12.3%, a difference of 0.18%), and Immigrants from Portugal (12.3%, a difference of 0.19%).
| Demographics | Rating | Rank | Male Disability |
| Norwegians | 0.2 /100 | #262 | Tragic 12.2% |
| Canadians | 0.2 /100 | #263 | Tragic 12.2% |
| Nepalese | 0.2 /100 | #264 | Tragic 12.2% |
| Immigrants | Portugal | 0.1 /100 | #265 | Tragic 12.3% |
| Hawaiians | 0.1 /100 | #266 | Tragic 12.3% |
| Immigrants | Germany | 0.1 /100 | #267 | Tragic 12.3% |
| Portuguese | 0.1 /100 | #268 | Tragic 12.3% |
| Czechoslovakians | 0.1 /100 | #269 | Tragic 12.3% |
| Spaniards | 0.1 /100 | #270 | Tragic 12.3% |
| Scandinavians | 0.1 /100 | #271 | Tragic 12.3% |
| Hmong | 0.0 /100 | #272 | Tragic 12.5% |
| Native Hawaiians | 0.0 /100 | #273 | Tragic 12.5% |
| Hopi | 0.0 /100 | #274 | Tragic 12.5% |
| Fijians | 0.0 /100 | #275 | Tragic 12.6% |
| Africans | 0.0 /100 | #276 | Tragic 12.6% |
Demographics Similar to Hungarians by Male Disability
In terms of male disability, the demographic groups most similar to Hungarians are Polish (12.0%, a difference of 0.18%), Danish (11.9%, a difference of 0.19%), Immigrants from Laos (11.9%, a difference of 0.22%), Immigrants from Liberia (11.9%, a difference of 0.22%), and Samoan (11.9%, a difference of 0.34%).
| Demographics | Rating | Rank | Male Disability |
| Czechs | 1.1 /100 | #240 | Tragic 11.9% |
| Bahamians | 1.1 /100 | #241 | Tragic 11.9% |
| Northern Europeans | 1.1 /100 | #242 | Tragic 11.9% |
| Samoans | 1.1 /100 | #243 | Tragic 11.9% |
| Immigrants | Laos | 1.0 /100 | #244 | Tragic 11.9% |
| Immigrants | Liberia | 1.0 /100 | #245 | Tragic 11.9% |
| Danes | 0.9 /100 | #246 | Tragic 11.9% |
| Hungarians | 0.8 /100 | #247 | Tragic 12.0% |
| Poles | 0.7 /100 | #248 | Tragic 12.0% |
| Immigrants | Yemen | 0.5 /100 | #249 | Tragic 12.0% |
| Bangladeshis | 0.5 /100 | #250 | Tragic 12.0% |
| German Russians | 0.5 /100 | #251 | Tragic 12.0% |
| Slovenes | 0.5 /100 | #252 | Tragic 12.0% |
| Guamanians/Chamorros | 0.5 /100 | #253 | Tragic 12.0% |
| British | 0.4 /100 | #254 | Tragic 12.1% |