Filipino vs Zimbabwean Disability Age 35 to 64
COMPARE
Filipino
Zimbabwean
Disability Age 35 to 64
Disability Age 35 to 64 Comparison
Filipinos
Zimbabweans
8.0%
DISABILITY AGE 35 TO 64
100.0/ 100
METRIC RATING
2nd/ 347
METRIC RANK
10.4%
DISABILITY AGE 35 TO 64
97.4/ 100
METRIC RATING
107th/ 347
METRIC RANK
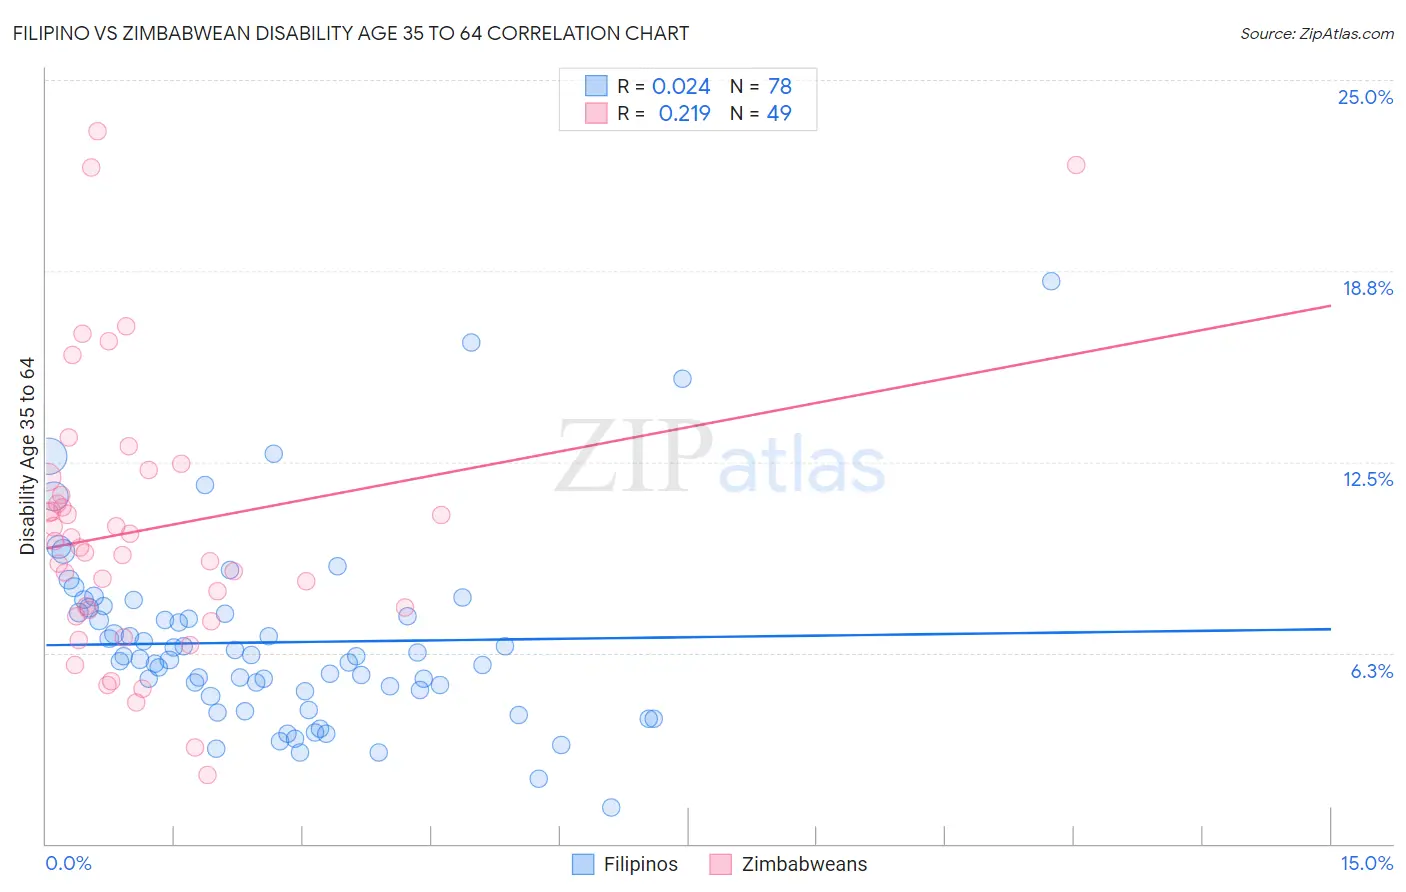
Filipino vs Zimbabwean Disability Age 35 to 64 Correlation Chart
The statistical analysis conducted on geographies consisting of 254,159,243 people shows no correlation between the proportion of Filipinos and percentage of population with a disability between the ages 34 and 64 in the United States with a correlation coefficient (R) of 0.024 and weighted average of 8.0%. Similarly, the statistical analysis conducted on geographies consisting of 69,187,609 people shows a weak positive correlation between the proportion of Zimbabweans and percentage of population with a disability between the ages 34 and 64 in the United States with a correlation coefficient (R) of 0.219 and weighted average of 10.4%, a difference of 29.8%.
Disability Age 35 to 64 Correlation Summary
| Measurement | Filipino | Zimbabwean |
| Minimum | 1.2% | 2.2% |
| Maximum | 18.4% | 23.3% |
| Range | 17.2% | 21.1% |
| Mean | 6.6% | 10.3% |
| Median | 6.1% | 9.7% |
| Interquartile 25% (IQ1) | 5.0% | 7.5% |
| Interquartile 75% (IQ3) | 7.6% | 11.7% |
| Interquartile Range (IQR) | 2.6% | 4.2% |
| Standard Deviation (Sample) | 3.0% | 4.5% |
| Standard Deviation (Population) | 3.0% | 4.5% |
Similar Demographics by Disability Age 35 to 64
Demographics Similar to Filipinos by Disability Age 35 to 64
In terms of disability age 35 to 64, the demographic groups most similar to Filipinos are Immigrants from Hong Kong (8.2%, a difference of 1.8%), Immigrants from Taiwan (7.8%, a difference of 2.5%), Immigrants from India (8.3%, a difference of 2.9%), Immigrants from Iran (8.5%, a difference of 5.5%), and Thai (8.6%, a difference of 6.5%).
| Demographics | Rating | Rank | Disability Age 35 to 64 |
| Immigrants | Taiwan | 100.0 /100 | #1 | Exceptional 7.8% |
| Filipinos | 100.0 /100 | #2 | Exceptional 8.0% |
| Immigrants | Hong Kong | 100.0 /100 | #3 | Exceptional 8.2% |
| Immigrants | India | 100.0 /100 | #4 | Exceptional 8.3% |
| Immigrants | Iran | 100.0 /100 | #5 | Exceptional 8.5% |
| Thais | 100.0 /100 | #6 | Exceptional 8.6% |
| Immigrants | Israel | 100.0 /100 | #7 | Exceptional 8.6% |
| Iranians | 100.0 /100 | #8 | Exceptional 8.7% |
| Immigrants | China | 100.0 /100 | #9 | Exceptional 8.7% |
| Immigrants | Bolivia | 100.0 /100 | #10 | Exceptional 8.7% |
| Immigrants | Eastern Asia | 100.0 /100 | #11 | Exceptional 8.8% |
| Indians (Asian) | 100.0 /100 | #12 | Exceptional 8.9% |
| Immigrants | South Central Asia | 100.0 /100 | #13 | Exceptional 8.9% |
| Immigrants | Singapore | 100.0 /100 | #14 | Exceptional 8.9% |
| Bolivians | 100.0 /100 | #15 | Exceptional 8.9% |
Demographics Similar to Zimbabweans by Disability Age 35 to 64
In terms of disability age 35 to 64, the demographic groups most similar to Zimbabweans are Ethiopian (10.5%, a difference of 0.020%), Immigrants from Ethiopia (10.5%, a difference of 0.15%), Immigrants from Hungary (10.4%, a difference of 0.19%), Korean (10.5%, a difference of 0.22%), and Macedonian (10.4%, a difference of 0.34%).
| Demographics | Rating | Rank | Disability Age 35 to 64 |
| Immigrants | Jordan | 98.1 /100 | #100 | Exceptional 10.4% |
| Immigrants | Philippines | 98.0 /100 | #101 | Exceptional 10.4% |
| Immigrants | Western Asia | 98.0 /100 | #102 | Exceptional 10.4% |
| Immigrants | Ukraine | 97.9 /100 | #103 | Exceptional 10.4% |
| Immigrants | Austria | 97.8 /100 | #104 | Exceptional 10.4% |
| Macedonians | 97.8 /100 | #105 | Exceptional 10.4% |
| Immigrants | Hungary | 97.6 /100 | #106 | Exceptional 10.4% |
| Zimbabweans | 97.4 /100 | #107 | Exceptional 10.4% |
| Ethiopians | 97.4 /100 | #108 | Exceptional 10.5% |
| Immigrants | Ethiopia | 97.2 /100 | #109 | Exceptional 10.5% |
| Koreans | 97.1 /100 | #110 | Exceptional 10.5% |
| Brazilians | 96.9 /100 | #111 | Exceptional 10.5% |
| Assyrians/Chaldeans/Syriacs | 96.8 /100 | #112 | Exceptional 10.5% |
| Tongans | 96.6 /100 | #113 | Exceptional 10.5% |
| Immigrants | Morocco | 96.6 /100 | #114 | Exceptional 10.5% |