Ukrainian vs Trinidadian and Tobagonian Disability Age 65 to 74
COMPARE
Ukrainian
Trinidadian and Tobagonian
Disability Age 65 to 74
Disability Age 65 to 74 Comparison
Ukrainians
Trinidadians and Tobagonians
22.3%
DISABILITY AGE 65 TO 74
95.1/ 100
METRIC RATING
114th/ 347
METRIC RANK
23.9%
DISABILITY AGE 65 TO 74
16.4/ 100
METRIC RATING
210th/ 347
METRIC RANK
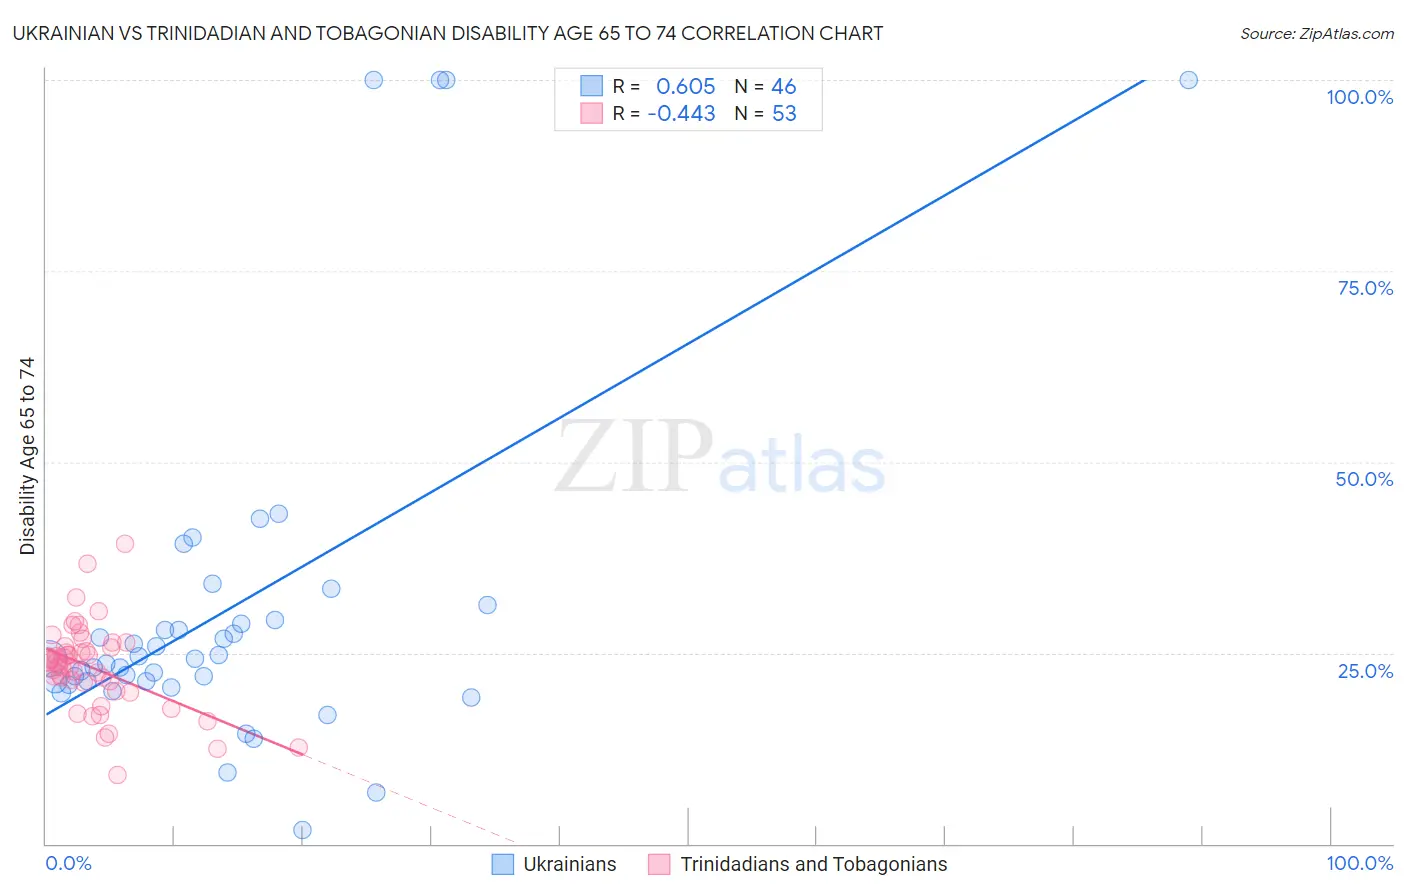
Ukrainian vs Trinidadian and Tobagonian Disability Age 65 to 74 Correlation Chart
The statistical analysis conducted on geographies consisting of 447,594,992 people shows a significant positive correlation between the proportion of Ukrainians and percentage of population with a disability between the ages 65 and 75 in the United States with a correlation coefficient (R) of 0.605 and weighted average of 22.3%. Similarly, the statistical analysis conducted on geographies consisting of 219,459,404 people shows a moderate negative correlation between the proportion of Trinidadians and Tobagonians and percentage of population with a disability between the ages 65 and 75 in the United States with a correlation coefficient (R) of -0.443 and weighted average of 23.9%, a difference of 7.0%.
Disability Age 65 to 74 Correlation Summary
| Measurement | Ukrainian | Trinidadian and Tobagonian |
| Minimum | 1.9% | 9.0% |
| Maximum | 100.0% | 39.2% |
| Range | 98.1% | 30.2% |
| Mean | 30.8% | 23.1% |
| Median | 24.2% | 23.7% |
| Interquartile 25% (IQ1) | 21.2% | 20.5% |
| Interquartile 75% (IQ3) | 29.3% | 25.8% |
| Interquartile Range (IQR) | 8.1% | 5.3% |
| Standard Deviation (Sample) | 23.1% | 5.6% |
| Standard Deviation (Population) | 22.8% | 5.6% |
Similar Demographics by Disability Age 65 to 74
Demographics Similar to Ukrainians by Disability Age 65 to 74
In terms of disability age 65 to 74, the demographic groups most similar to Ukrainians are Laotian (22.3%, a difference of 0.060%), Syrian (22.3%, a difference of 0.080%), Brazilian (22.4%, a difference of 0.10%), Swedish (22.4%, a difference of 0.12%), and Austrian (22.4%, a difference of 0.12%).
| Demographics | Rating | Rank | Disability Age 65 to 74 |
| Slovenes | 96.1 /100 | #107 | Exceptional 22.2% |
| Immigrants | Zimbabwe | 96.1 /100 | #108 | Exceptional 22.3% |
| Albanians | 95.8 /100 | #109 | Exceptional 22.3% |
| Immigrants | Peru | 95.7 /100 | #110 | Exceptional 22.3% |
| Serbians | 95.7 /100 | #111 | Exceptional 22.3% |
| Immigrants | South America | 95.5 /100 | #112 | Exceptional 22.3% |
| Syrians | 95.3 /100 | #113 | Exceptional 22.3% |
| Ukrainians | 95.1 /100 | #114 | Exceptional 22.3% |
| Laotians | 94.9 /100 | #115 | Exceptional 22.3% |
| Brazilians | 94.8 /100 | #116 | Exceptional 22.4% |
| Swedes | 94.7 /100 | #117 | Exceptional 22.4% |
| Austrians | 94.7 /100 | #118 | Exceptional 22.4% |
| Immigrants | Northern Africa | 94.7 /100 | #119 | Exceptional 22.4% |
| Immigrants | Kazakhstan | 93.9 /100 | #120 | Exceptional 22.4% |
| Czechs | 93.5 /100 | #121 | Exceptional 22.4% |
Demographics Similar to Trinidadians and Tobagonians by Disability Age 65 to 74
In terms of disability age 65 to 74, the demographic groups most similar to Trinidadians and Tobagonians are Immigrants from West Indies (23.9%, a difference of 0.050%), French (23.9%, a difference of 0.070%), Nicaraguan (23.9%, a difference of 0.23%), Immigrants from Barbados (23.8%, a difference of 0.31%), and Immigrants from Kenya (23.8%, a difference of 0.31%).
| Demographics | Rating | Rank | Disability Age 65 to 74 |
| Kenyans | 23.2 /100 | #203 | Fair 23.7% |
| Immigrants | Grenada | 22.1 /100 | #204 | Fair 23.8% |
| Tongans | 20.8 /100 | #205 | Fair 23.8% |
| Immigrants | Jamaica | 20.7 /100 | #206 | Fair 23.8% |
| Immigrants | Sudan | 20.1 /100 | #207 | Fair 23.8% |
| Immigrants | Barbados | 19.6 /100 | #208 | Poor 23.8% |
| Immigrants | Kenya | 19.6 /100 | #209 | Poor 23.8% |
| Trinidadians and Tobagonians | 16.4 /100 | #210 | Poor 23.9% |
| Immigrants | West Indies | 15.9 /100 | #211 | Poor 23.9% |
| French | 15.7 /100 | #212 | Poor 23.9% |
| Nicaraguans | 14.3 /100 | #213 | Poor 23.9% |
| Immigrants | Oceania | 13.6 /100 | #214 | Poor 24.0% |
| Pennsylvania Germans | 13.3 /100 | #215 | Poor 24.0% |
| Jamaicans | 12.2 /100 | #216 | Poor 24.0% |
| Immigrants | Portugal | 11.7 /100 | #217 | Poor 24.0% |