Estonian vs Houma Hearing Disability
COMPARE
Estonian
Houma
Hearing Disability
Hearing Disability Comparison
Estonians
Houma
3.3%
HEARING DISABILITY
2.4/ 100
METRIC RATING
233rd/ 347
METRIC RANK
4.2%
HEARING DISABILITY
0.0/ 100
METRIC RATING
332nd/ 347
METRIC RANK
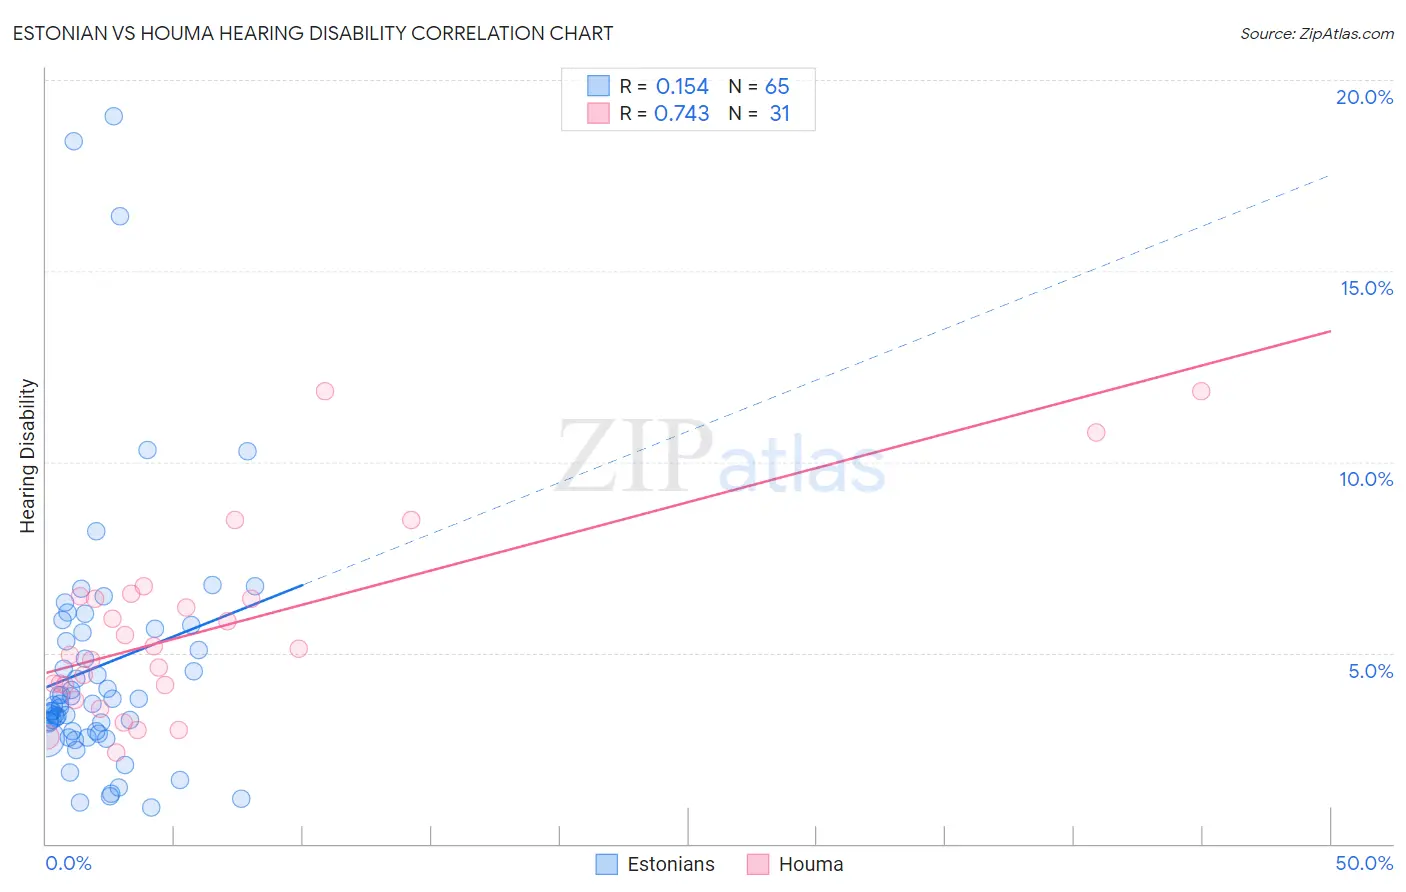
Estonian vs Houma Hearing Disability Correlation Chart
The statistical analysis conducted on geographies consisting of 123,522,478 people shows a poor positive correlation between the proportion of Estonians and percentage of population with hearing disability in the United States with a correlation coefficient (R) of 0.154 and weighted average of 3.3%. Similarly, the statistical analysis conducted on geographies consisting of 36,798,453 people shows a strong positive correlation between the proportion of Houma and percentage of population with hearing disability in the United States with a correlation coefficient (R) of 0.743 and weighted average of 4.2%, a difference of 30.0%.
Hearing Disability Correlation Summary
| Measurement | Estonian | Houma |
| Minimum | 0.96% | 2.4% |
| Maximum | 19.0% | 11.9% |
| Range | 18.1% | 9.5% |
| Mean | 4.7% | 5.6% |
| Median | 3.7% | 5.1% |
| Interquartile 25% (IQ1) | 2.9% | 4.1% |
| Interquartile 75% (IQ3) | 5.6% | 6.5% |
| Interquartile Range (IQR) | 2.7% | 2.3% |
| Standard Deviation (Sample) | 3.5% | 2.5% |
| Standard Deviation (Population) | 3.5% | 2.4% |
Similar Demographics by Hearing Disability
Demographics Similar to Estonians by Hearing Disability
In terms of hearing disability, the demographic groups most similar to Estonians are Central American Indian (3.3%, a difference of 0.070%), Guamanian/Chamorro (3.3%, a difference of 0.17%), Serbian (3.3%, a difference of 0.24%), Ukrainian (3.2%, a difference of 0.37%), and Luxembourger (3.2%, a difference of 0.42%).
| Demographics | Rating | Rank | Hearing Disability |
| Lebanese | 5.0 /100 | #226 | Tragic 3.2% |
| Bhutanese | 4.6 /100 | #227 | Tragic 3.2% |
| Immigrants | Portugal | 4.3 /100 | #228 | Tragic 3.2% |
| Maltese | 4.1 /100 | #229 | Tragic 3.2% |
| Greeks | 3.2 /100 | #230 | Tragic 3.2% |
| Luxembourgers | 2.9 /100 | #231 | Tragic 3.2% |
| Ukrainians | 2.9 /100 | #232 | Tragic 3.2% |
| Estonians | 2.4 /100 | #233 | Tragic 3.3% |
| Central American Indians | 2.3 /100 | #234 | Tragic 3.3% |
| Guamanians/Chamorros | 2.2 /100 | #235 | Tragic 3.3% |
| Serbians | 2.2 /100 | #236 | Tragic 3.3% |
| Immigrants | Austria | 1.8 /100 | #237 | Tragic 3.3% |
| German Russians | 1.8 /100 | #238 | Tragic 3.3% |
| Nepalese | 1.2 /100 | #239 | Tragic 3.3% |
| Immigrants | Netherlands | 1.1 /100 | #240 | Tragic 3.3% |
Demographics Similar to Houma by Hearing Disability
In terms of hearing disability, the demographic groups most similar to Houma are Dutch West Indian (4.3%, a difference of 0.59%), Cherokee (4.2%, a difference of 0.68%), Native/Alaskan (4.2%, a difference of 0.83%), Aleut (4.3%, a difference of 1.1%), and Crow (4.2%, a difference of 1.6%).
| Demographics | Rating | Rank | Hearing Disability |
| Lumbee | 0.0 /100 | #325 | Tragic 4.1% |
| Potawatomi | 0.0 /100 | #326 | Tragic 4.1% |
| Arapaho | 0.0 /100 | #327 | Tragic 4.1% |
| Tohono O'odham | 0.0 /100 | #328 | Tragic 4.2% |
| Crow | 0.0 /100 | #329 | Tragic 4.2% |
| Natives/Alaskans | 0.0 /100 | #330 | Tragic 4.2% |
| Cherokee | 0.0 /100 | #331 | Tragic 4.2% |
| Houma | 0.0 /100 | #332 | Tragic 4.2% |
| Dutch West Indians | 0.0 /100 | #333 | Tragic 4.3% |
| Aleuts | 0.0 /100 | #334 | Tragic 4.3% |
| Kiowa | 0.0 /100 | #335 | Tragic 4.3% |
| Creek | 0.0 /100 | #336 | Tragic 4.4% |
| Chickasaw | 0.0 /100 | #337 | Tragic 4.5% |
| Alaska Natives | 0.0 /100 | #338 | Tragic 4.5% |
| Choctaw | 0.0 /100 | #339 | Tragic 4.5% |