English vs Immigrants from Belize Cognitive Disability
COMPARE
English
Immigrants from Belize
Cognitive Disability
Cognitive Disability Comparison
English
Immigrants from Belize
16.8%
COGNITIVE DISABILITY
98.6/ 100
METRIC RATING
95th/ 347
METRIC RANK
17.9%
COGNITIVE DISABILITY
0.5/ 100
METRIC RATING
260th/ 347
METRIC RANK
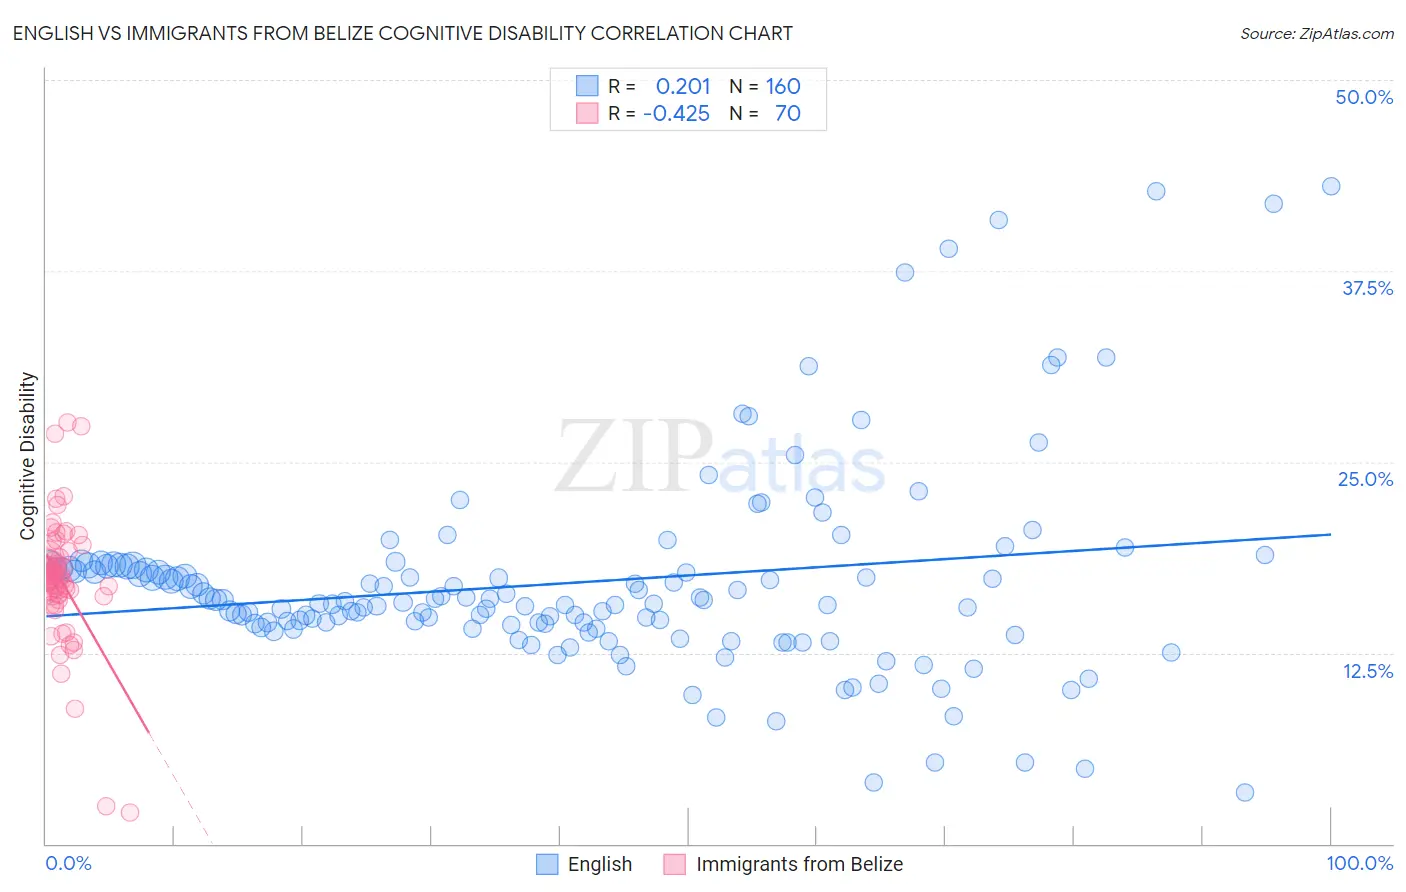
English vs Immigrants from Belize Cognitive Disability Correlation Chart
The statistical analysis conducted on geographies consisting of 579,706,008 people shows a weak positive correlation between the proportion of English and percentage of population with cognitive disability in the United States with a correlation coefficient (R) of 0.201 and weighted average of 16.8%. Similarly, the statistical analysis conducted on geographies consisting of 130,294,835 people shows a moderate negative correlation between the proportion of Immigrants from Belize and percentage of population with cognitive disability in the United States with a correlation coefficient (R) of -0.425 and weighted average of 17.9%, a difference of 7.0%.
Cognitive Disability Correlation Summary
| Measurement | English | Immigrants from Belize |
| Minimum | 3.4% | 2.1% |
| Maximum | 43.0% | 27.6% |
| Range | 39.7% | 25.5% |
| Mean | 17.1% | 17.3% |
| Median | 15.8% | 17.3% |
| Interquartile 25% (IQ1) | 14.3% | 16.3% |
| Interquartile 75% (IQ3) | 18.1% | 18.7% |
| Interquartile Range (IQR) | 3.8% | 2.4% |
| Standard Deviation (Sample) | 6.6% | 4.1% |
| Standard Deviation (Population) | 6.6% | 4.1% |
Similar Demographics by Cognitive Disability
Demographics Similar to English by Cognitive Disability
In terms of cognitive disability, the demographic groups most similar to English are Finnish (16.8%, a difference of 0.020%), Dutch (16.8%, a difference of 0.040%), Asian (16.7%, a difference of 0.060%), Immigrants from Lebanon (16.8%, a difference of 0.060%), and Immigrants from South America (16.7%, a difference of 0.11%).
| Demographics | Rating | Rank | Cognitive Disability |
| Immigrants | Philippines | 99.0 /100 | #88 | Exceptional 16.7% |
| Immigrants | Egypt | 98.8 /100 | #89 | Exceptional 16.7% |
| South Americans | 98.8 /100 | #90 | Exceptional 16.7% |
| Danes | 98.8 /100 | #91 | Exceptional 16.7% |
| Immigrants | South America | 98.8 /100 | #92 | Exceptional 16.7% |
| Immigrants | Southern Europe | 98.7 /100 | #93 | Exceptional 16.7% |
| Asians | 98.7 /100 | #94 | Exceptional 16.7% |
| English | 98.6 /100 | #95 | Exceptional 16.8% |
| Finns | 98.5 /100 | #96 | Exceptional 16.8% |
| Dutch | 98.5 /100 | #97 | Exceptional 16.8% |
| Immigrants | Lebanon | 98.4 /100 | #98 | Exceptional 16.8% |
| Jordanians | 98.2 /100 | #99 | Exceptional 16.8% |
| Immigrants | Russia | 98.2 /100 | #100 | Exceptional 16.8% |
| Immigrants | Asia | 98.1 /100 | #101 | Exceptional 16.8% |
| Irish | 98.1 /100 | #102 | Exceptional 16.8% |
Demographics Similar to Immigrants from Belize by Cognitive Disability
In terms of cognitive disability, the demographic groups most similar to Immigrants from Belize are Ethiopian (17.9%, a difference of 0.010%), Guamanian/Chamorro (17.9%, a difference of 0.050%), Sierra Leonean (17.9%, a difference of 0.080%), Immigrants from Armenia (17.9%, a difference of 0.090%), and Mexican American Indian (17.9%, a difference of 0.10%).
| Demographics | Rating | Rank | Cognitive Disability |
| Hopi | 0.6 /100 | #253 | Tragic 17.9% |
| Hispanics or Latinos | 0.6 /100 | #254 | Tragic 17.9% |
| Immigrants | Azores | 0.6 /100 | #255 | Tragic 17.9% |
| Bahamians | 0.6 /100 | #256 | Tragic 17.9% |
| Mexican American Indians | 0.6 /100 | #257 | Tragic 17.9% |
| Immigrants | Armenia | 0.6 /100 | #258 | Tragic 17.9% |
| Ethiopians | 0.5 /100 | #259 | Tragic 17.9% |
| Immigrants | Belize | 0.5 /100 | #260 | Tragic 17.9% |
| Guamanians/Chamorros | 0.5 /100 | #261 | Tragic 17.9% |
| Sierra Leoneans | 0.4 /100 | #262 | Tragic 17.9% |
| Immigrants | Barbados | 0.4 /100 | #263 | Tragic 17.9% |
| Menominee | 0.4 /100 | #264 | Tragic 18.0% |
| Spanish Americans | 0.4 /100 | #265 | Tragic 18.0% |
| Belizeans | 0.4 /100 | #266 | Tragic 18.0% |
| Nepalese | 0.3 /100 | #267 | Tragic 18.0% |