Egyptian vs Immigrants from France No Vehicles in Household
COMPARE
Egyptian
Immigrants from France
No Vehicles in Household
No Vehicles in Household Comparison
Egyptians
Immigrants from France
11.9%
NO VEHICLES IN HOUSEHOLD
1.4/ 100
METRIC RATING
253rd/ 347
METRIC RANK
12.9%
NO VEHICLES IN HOUSEHOLD
0.1/ 100
METRIC RATING
273rd/ 347
METRIC RANK
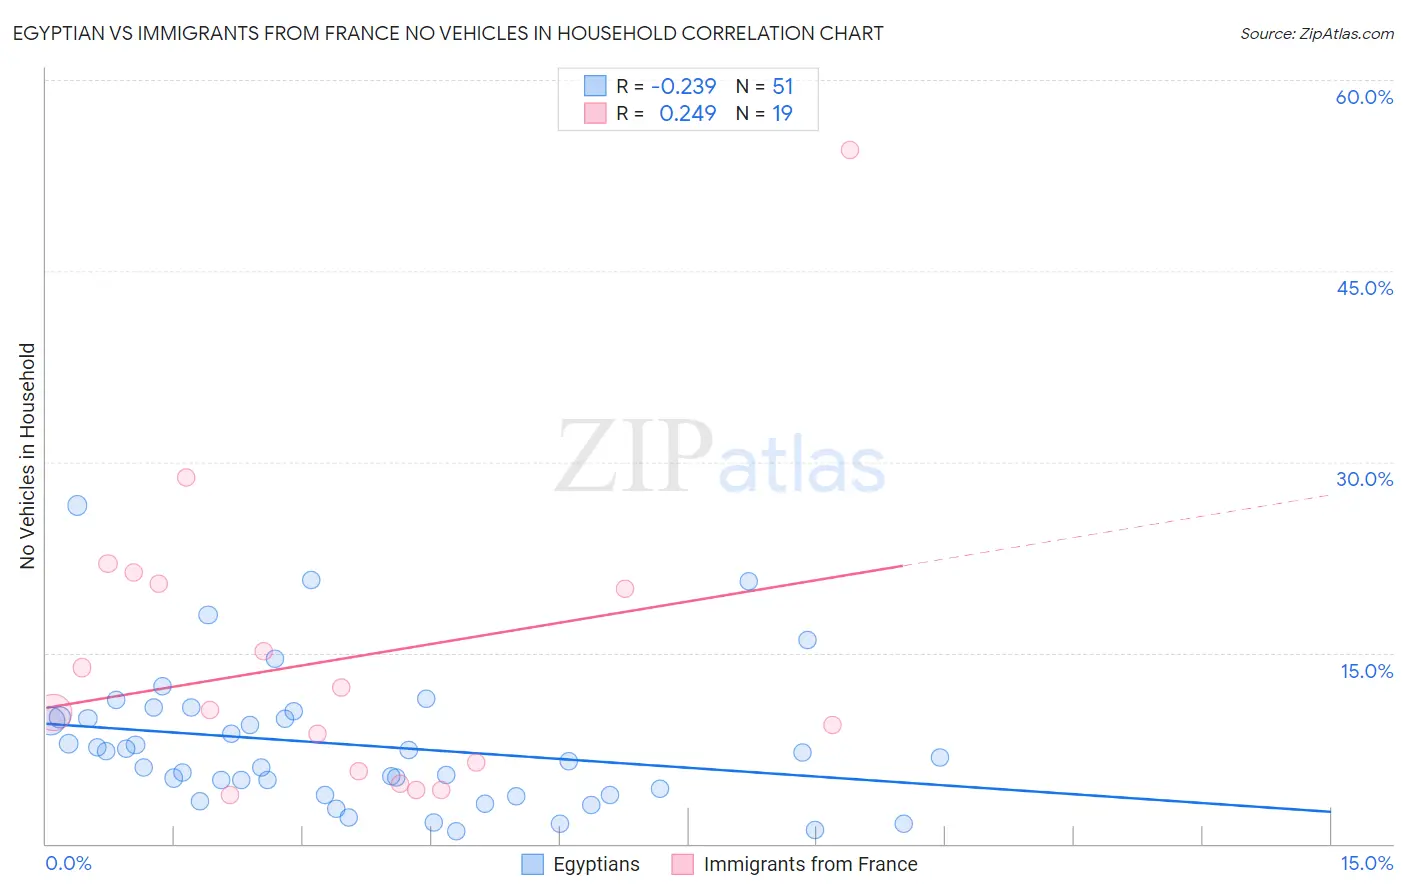
Egyptian vs Immigrants from France No Vehicles in Household Correlation Chart
The statistical analysis conducted on geographies consisting of 276,394,787 people shows a weak negative correlation between the proportion of Egyptians and percentage of households with no vehicle available in the United States with a correlation coefficient (R) of -0.239 and weighted average of 11.9%. Similarly, the statistical analysis conducted on geographies consisting of 287,518,995 people shows a weak positive correlation between the proportion of Immigrants from France and percentage of households with no vehicle available in the United States with a correlation coefficient (R) of 0.249 and weighted average of 12.9%, a difference of 8.8%.
No Vehicles in Household Correlation Summary
| Measurement | Egyptian | Immigrants from France |
| Minimum | 1.0% | 3.9% |
| Maximum | 26.6% | 54.5% |
| Range | 25.6% | 50.6% |
| Mean | 7.8% | 14.5% |
| Median | 6.8% | 10.5% |
| Interquartile 25% (IQ1) | 3.8% | 5.7% |
| Interquartile 75% (IQ3) | 9.9% | 20.4% |
| Interquartile Range (IQR) | 6.1% | 14.7% |
| Standard Deviation (Sample) | 5.4% | 12.1% |
| Standard Deviation (Population) | 5.3% | 11.8% |
Demographics Similar to Egyptians and Immigrants from France by No Vehicles in Household
In terms of no vehicles in household, the demographic groups most similar to Egyptians are Immigrants from Uruguay (11.9%, a difference of 0.32%), Honduran (12.0%, a difference of 0.59%), Liberian (12.0%, a difference of 0.64%), Nigerian (12.1%, a difference of 1.4%), and South American Indian (12.1%, a difference of 1.4%). Similarly, the demographic groups most similar to Immigrants from France are Bermudan (12.8%, a difference of 1.2%), Immigrants from Morocco (12.6%, a difference of 2.6%), Immigrants from Northern Africa (12.6%, a difference of 2.7%), Panamanian (12.5%, a difference of 3.3%), and Immigrants from Africa (12.5%, a difference of 3.4%).
| Demographics | Rating | Rank | No Vehicles in Household |
| Egyptians | 1.4 /100 | #253 | Tragic 11.9% |
| Immigrants | Uruguay | 1.3 /100 | #254 | Tragic 11.9% |
| Hondurans | 1.2 /100 | #255 | Tragic 12.0% |
| Liberians | 1.2 /100 | #256 | Tragic 12.0% |
| Nigerians | 0.9 /100 | #257 | Tragic 12.1% |
| South American Indians | 0.9 /100 | #258 | Tragic 12.1% |
| Immigrants | Latvia | 0.8 /100 | #259 | Tragic 12.1% |
| Macedonians | 0.7 /100 | #260 | Tragic 12.2% |
| Sub-Saharan Africans | 0.6 /100 | #261 | Tragic 12.2% |
| Immigrants | Liberia | 0.6 /100 | #262 | Tragic 12.2% |
| Immigrants | Egypt | 0.6 /100 | #263 | Tragic 12.2% |
| Immigrants | Switzerland | 0.5 /100 | #264 | Tragic 12.3% |
| Africans | 0.4 /100 | #265 | Tragic 12.3% |
| Israelis | 0.3 /100 | #266 | Tragic 12.4% |
| Immigrants | Europe | 0.3 /100 | #267 | Tragic 12.5% |
| Immigrants | Africa | 0.2 /100 | #268 | Tragic 12.5% |
| Panamanians | 0.2 /100 | #269 | Tragic 12.5% |
| Immigrants | Northern Africa | 0.2 /100 | #270 | Tragic 12.6% |
| Immigrants | Morocco | 0.2 /100 | #271 | Tragic 12.6% |
| Bermudans | 0.1 /100 | #272 | Tragic 12.8% |
| Immigrants | France | 0.1 /100 | #273 | Tragic 12.9% |