Dutch West Indian vs Immigrants from Guatemala Disability Age Under 5
COMPARE
Dutch West Indian
Immigrants from Guatemala
Disability Age Under 5
Disability Age Under 5 Comparison
Dutch West Indians
Immigrants from Guatemala
1.9%
DISABILITY AGE UNDER 5
0.0/ 100
METRIC RATING
333rd/ 347
METRIC RANK
1.2%
DISABILITY AGE UNDER 5
63.2/ 100
METRIC RATING
163rd/ 347
METRIC RANK
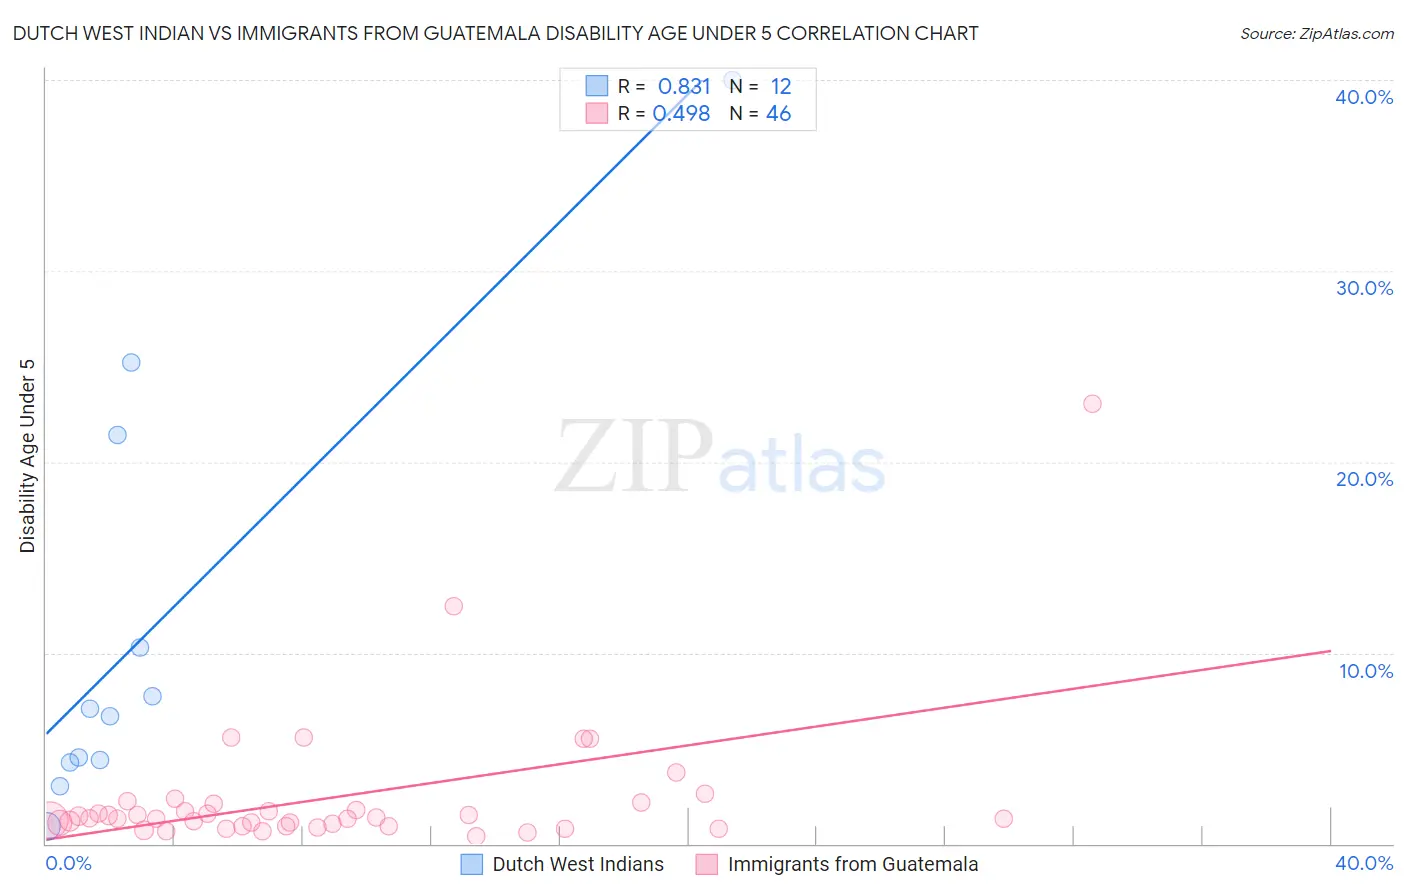
Dutch West Indian vs Immigrants from Guatemala Disability Age Under 5 Correlation Chart
The statistical analysis conducted on geographies consisting of 63,691,358 people shows a very strong positive correlation between the proportion of Dutch West Indians and percentage of population with a disability under the age of 5 in the United States with a correlation coefficient (R) of 0.831 and weighted average of 1.9%. Similarly, the statistical analysis conducted on geographies consisting of 214,173,088 people shows a moderate positive correlation between the proportion of Immigrants from Guatemala and percentage of population with a disability under the age of 5 in the United States with a correlation coefficient (R) of 0.498 and weighted average of 1.2%, a difference of 58.0%.
Disability Age Under 5 Correlation Summary
| Measurement | Dutch West Indian | Immigrants from Guatemala |
| Minimum | 0.90% | 0.42% |
| Maximum | 40.0% | 23.1% |
| Range | 39.1% | 22.7% |
| Mean | 11.3% | 2.4% |
| Median | 6.9% | 1.3% |
| Interquartile 25% (IQ1) | 4.3% | 0.93% |
| Interquartile 75% (IQ3) | 15.9% | 2.1% |
| Interquartile Range (IQR) | 11.5% | 1.2% |
| Standard Deviation (Sample) | 11.6% | 3.7% |
| Standard Deviation (Population) | 11.2% | 3.7% |
Similar Demographics by Disability Age Under 5
Demographics Similar to Dutch West Indians by Disability Age Under 5
In terms of disability age under 5, the demographic groups most similar to Dutch West Indians are Native/Alaskan (1.9%, a difference of 0.40%), Pennsylvania German (1.9%, a difference of 0.78%), Paraguayan (2.0%, a difference of 2.1%), Chippewa (1.9%, a difference of 2.9%), and French Canadian (1.9%, a difference of 3.0%).
| Demographics | Rating | Rank | Disability Age Under 5 |
| Sioux | 0.0 /100 | #326 | Tragic 1.8% |
| Osage | 0.0 /100 | #327 | Tragic 1.8% |
| Americans | 0.0 /100 | #328 | Tragic 1.9% |
| Houma | 0.0 /100 | #329 | Tragic 1.9% |
| Choctaw | 0.0 /100 | #330 | Tragic 1.9% |
| French Canadians | 0.0 /100 | #331 | Tragic 1.9% |
| Chippewa | 0.0 /100 | #332 | Tragic 1.9% |
| Dutch West Indians | 0.0 /100 | #333 | Tragic 1.9% |
| Natives/Alaskans | 0.0 /100 | #334 | Tragic 1.9% |
| Pennsylvania Germans | 0.0 /100 | #335 | Tragic 1.9% |
| Paraguayans | 0.0 /100 | #336 | Tragic 2.0% |
| Apache | 0.0 /100 | #337 | Tragic 2.0% |
| Tohono O'odham | 0.0 /100 | #338 | Tragic 2.2% |
| Immigrants | Azores | 0.0 /100 | #339 | Tragic 2.2% |
| Menominee | 0.0 /100 | #340 | Tragic 2.3% |
Demographics Similar to Immigrants from Guatemala by Disability Age Under 5
In terms of disability age under 5, the demographic groups most similar to Immigrants from Guatemala are Guatemalan (1.2%, a difference of 0.030%), Laotian (1.2%, a difference of 0.050%), Immigrants from Kuwait (1.2%, a difference of 0.070%), Immigrants from Central America (1.2%, a difference of 0.18%), and Immigrants from Africa (1.2%, a difference of 0.19%).
| Demographics | Rating | Rank | Disability Age Under 5 |
| Hawaiians | 68.5 /100 | #156 | Good 1.2% |
| Immigrants | South America | 67.0 /100 | #157 | Good 1.2% |
| Arabs | 66.4 /100 | #158 | Good 1.2% |
| Colombians | 65.8 /100 | #159 | Good 1.2% |
| Immigrants | Latin America | 65.8 /100 | #160 | Good 1.2% |
| Immigrants | Africa | 65.1 /100 | #161 | Good 1.2% |
| Guatemalans | 63.6 /100 | #162 | Good 1.2% |
| Immigrants | Guatemala | 63.2 /100 | #163 | Good 1.2% |
| Laotians | 62.8 /100 | #164 | Good 1.2% |
| Immigrants | Kuwait | 62.6 /100 | #165 | Good 1.2% |
| Immigrants | Central America | 61.4 /100 | #166 | Good 1.2% |
| Immigrants | Argentina | 60.2 /100 | #167 | Good 1.2% |
| Sierra Leoneans | 59.1 /100 | #168 | Average 1.2% |
| Immigrants | Uruguay | 59.0 /100 | #169 | Average 1.2% |
| Immigrants | Jamaica | 58.8 /100 | #170 | Average 1.2% |