Immigrants from India vs Immigrants from Guatemala Disability Age Under 5
COMPARE
Immigrants from India
Immigrants from Guatemala
Disability Age Under 5
Disability Age Under 5 Comparison
Immigrants from India
Immigrants from Guatemala
1.0%
DISABILITY AGE UNDER 5
99.9/ 100
METRIC RATING
37th/ 347
METRIC RANK
1.2%
DISABILITY AGE UNDER 5
63.2/ 100
METRIC RATING
163rd/ 347
METRIC RANK
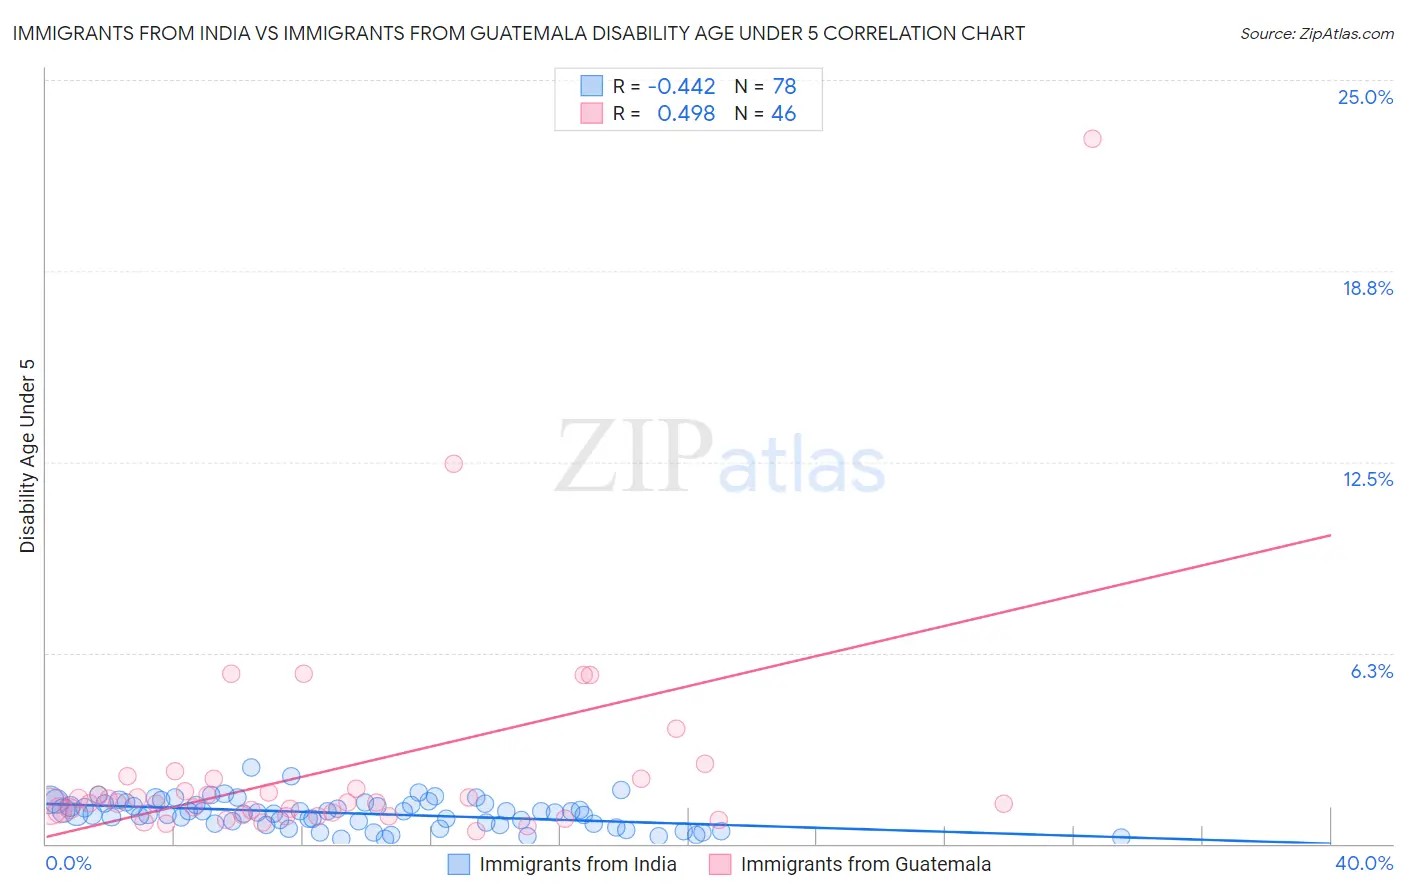
Immigrants from India vs Immigrants from Guatemala Disability Age Under 5 Correlation Chart
The statistical analysis conducted on geographies consisting of 228,217,406 people shows a moderate negative correlation between the proportion of Immigrants from India and percentage of population with a disability under the age of 5 in the United States with a correlation coefficient (R) of -0.442 and weighted average of 1.0%. Similarly, the statistical analysis conducted on geographies consisting of 214,173,088 people shows a moderate positive correlation between the proportion of Immigrants from Guatemala and percentage of population with a disability under the age of 5 in the United States with a correlation coefficient (R) of 0.498 and weighted average of 1.2%, a difference of 17.3%.
Disability Age Under 5 Correlation Summary
| Measurement | Immigrants from India | Immigrants from Guatemala |
| Minimum | 0.16% | 0.42% |
| Maximum | 2.5% | 23.1% |
| Range | 2.3% | 22.7% |
| Mean | 1.00% | 2.4% |
| Median | 1.0% | 1.3% |
| Interquartile 25% (IQ1) | 0.67% | 0.93% |
| Interquartile 75% (IQ3) | 1.3% | 2.1% |
| Interquartile Range (IQR) | 0.66% | 1.2% |
| Standard Deviation (Sample) | 0.47% | 3.7% |
| Standard Deviation (Population) | 0.47% | 3.7% |
Similar Demographics by Disability Age Under 5
Demographics Similar to Immigrants from India by Disability Age Under 5
In terms of disability age under 5, the demographic groups most similar to Immigrants from India are Immigrants from Nepal (1.0%, a difference of 0.020%), Immigrants from Guyana (1.0%, a difference of 0.080%), Barbadian (1.0%, a difference of 0.73%), Filipino (1.1%, a difference of 0.76%), and Immigrants from Ukraine (1.0%, a difference of 0.97%).
| Demographics | Rating | Rank | Disability Age Under 5 |
| Immigrants | South Central Asia | 99.9 /100 | #30 | Exceptional 1.0% |
| Armenians | 99.9 /100 | #31 | Exceptional 1.0% |
| Iranians | 99.9 /100 | #32 | Exceptional 1.0% |
| Bolivians | 99.9 /100 | #33 | Exceptional 1.0% |
| Immigrants | Ukraine | 99.9 /100 | #34 | Exceptional 1.0% |
| Barbadians | 99.9 /100 | #35 | Exceptional 1.0% |
| Immigrants | Nepal | 99.9 /100 | #36 | Exceptional 1.0% |
| Immigrants | India | 99.9 /100 | #37 | Exceptional 1.0% |
| Immigrants | Guyana | 99.9 /100 | #38 | Exceptional 1.0% |
| Filipinos | 99.9 /100 | #39 | Exceptional 1.1% |
| Immigrants | Albania | 99.9 /100 | #40 | Exceptional 1.1% |
| Thais | 99.8 /100 | #41 | Exceptional 1.1% |
| Immigrants | Bulgaria | 99.8 /100 | #42 | Exceptional 1.1% |
| Pima | 99.8 /100 | #43 | Exceptional 1.1% |
| Immigrants | Asia | 99.8 /100 | #44 | Exceptional 1.1% |
Demographics Similar to Immigrants from Guatemala by Disability Age Under 5
In terms of disability age under 5, the demographic groups most similar to Immigrants from Guatemala are Guatemalan (1.2%, a difference of 0.030%), Laotian (1.2%, a difference of 0.050%), Immigrants from Kuwait (1.2%, a difference of 0.070%), Immigrants from Central America (1.2%, a difference of 0.18%), and Immigrants from Africa (1.2%, a difference of 0.19%).
| Demographics | Rating | Rank | Disability Age Under 5 |
| Hawaiians | 68.5 /100 | #156 | Good 1.2% |
| Immigrants | South America | 67.0 /100 | #157 | Good 1.2% |
| Arabs | 66.4 /100 | #158 | Good 1.2% |
| Colombians | 65.8 /100 | #159 | Good 1.2% |
| Immigrants | Latin America | 65.8 /100 | #160 | Good 1.2% |
| Immigrants | Africa | 65.1 /100 | #161 | Good 1.2% |
| Guatemalans | 63.6 /100 | #162 | Good 1.2% |
| Immigrants | Guatemala | 63.2 /100 | #163 | Good 1.2% |
| Laotians | 62.8 /100 | #164 | Good 1.2% |
| Immigrants | Kuwait | 62.6 /100 | #165 | Good 1.2% |
| Immigrants | Central America | 61.4 /100 | #166 | Good 1.2% |
| Immigrants | Argentina | 60.2 /100 | #167 | Good 1.2% |
| Sierra Leoneans | 59.1 /100 | #168 | Average 1.2% |
| Immigrants | Uruguay | 59.0 /100 | #169 | Average 1.2% |
| Immigrants | Jamaica | 58.8 /100 | #170 | Average 1.2% |