Dutch West Indian vs South American Indian Disability Age Under 5
COMPARE
Dutch West Indian
South American Indian
Disability Age Under 5
Disability Age Under 5 Comparison
Dutch West Indians
South American Indians
1.9%
DISABILITY AGE UNDER 5
0.0/ 100
METRIC RATING
333rd/ 347
METRIC RANK
1.3%
DISABILITY AGE UNDER 5
3.3/ 100
METRIC RATING
236th/ 347
METRIC RANK
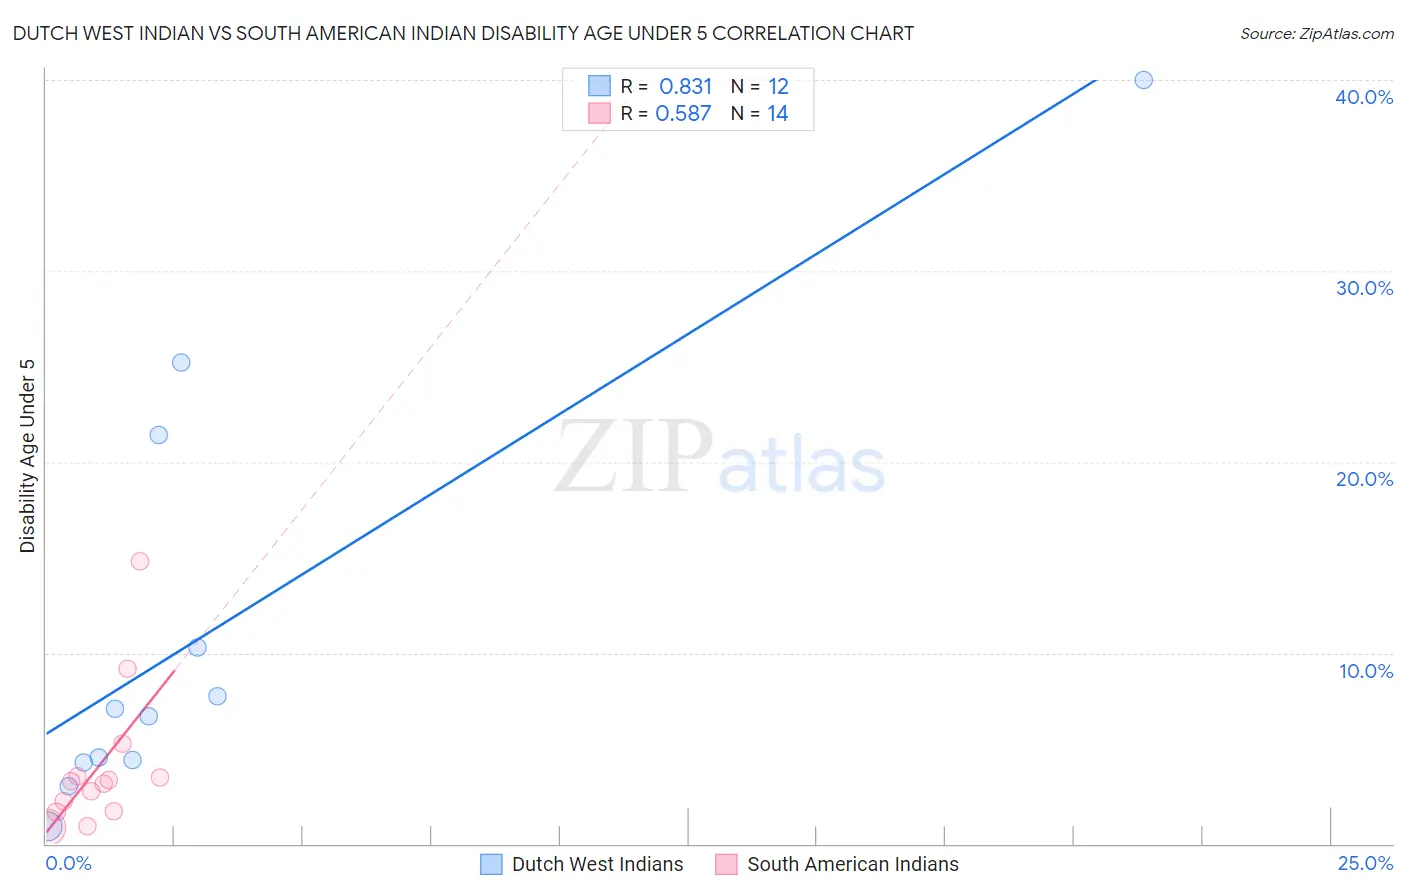
Dutch West Indian vs South American Indian Disability Age Under 5 Correlation Chart
The statistical analysis conducted on geographies consisting of 63,691,358 people shows a very strong positive correlation between the proportion of Dutch West Indians and percentage of population with a disability under the age of 5 in the United States with a correlation coefficient (R) of 0.831 and weighted average of 1.9%. Similarly, the statistical analysis conducted on geographies consisting of 114,062,078 people shows a substantial positive correlation between the proportion of South American Indians and percentage of population with a disability under the age of 5 in the United States with a correlation coefficient (R) of 0.587 and weighted average of 1.3%, a difference of 45.0%.
Disability Age Under 5 Correlation Summary
| Measurement | Dutch West Indian | South American Indian |
| Minimum | 0.90% | 0.86% |
| Maximum | 40.0% | 14.8% |
| Range | 39.1% | 13.9% |
| Mean | 11.3% | 4.0% |
| Median | 6.9% | 3.2% |
| Interquartile 25% (IQ1) | 4.3% | 1.7% |
| Interquartile 75% (IQ3) | 15.9% | 3.6% |
| Interquartile Range (IQR) | 11.5% | 1.8% |
| Standard Deviation (Sample) | 11.6% | 3.7% |
| Standard Deviation (Population) | 11.2% | 3.6% |
Similar Demographics by Disability Age Under 5
Demographics Similar to Dutch West Indians by Disability Age Under 5
In terms of disability age under 5, the demographic groups most similar to Dutch West Indians are Native/Alaskan (1.9%, a difference of 0.40%), Pennsylvania German (1.9%, a difference of 0.78%), Paraguayan (2.0%, a difference of 2.1%), Chippewa (1.9%, a difference of 2.9%), and French Canadian (1.9%, a difference of 3.0%).
| Demographics | Rating | Rank | Disability Age Under 5 |
| Sioux | 0.0 /100 | #326 | Tragic 1.8% |
| Osage | 0.0 /100 | #327 | Tragic 1.8% |
| Americans | 0.0 /100 | #328 | Tragic 1.9% |
| Houma | 0.0 /100 | #329 | Tragic 1.9% |
| Choctaw | 0.0 /100 | #330 | Tragic 1.9% |
| French Canadians | 0.0 /100 | #331 | Tragic 1.9% |
| Chippewa | 0.0 /100 | #332 | Tragic 1.9% |
| Dutch West Indians | 0.0 /100 | #333 | Tragic 1.9% |
| Natives/Alaskans | 0.0 /100 | #334 | Tragic 1.9% |
| Pennsylvania Germans | 0.0 /100 | #335 | Tragic 1.9% |
| Paraguayans | 0.0 /100 | #336 | Tragic 2.0% |
| Apache | 0.0 /100 | #337 | Tragic 2.0% |
| Tohono O'odham | 0.0 /100 | #338 | Tragic 2.2% |
| Immigrants | Azores | 0.0 /100 | #339 | Tragic 2.2% |
| Menominee | 0.0 /100 | #340 | Tragic 2.3% |
Demographics Similar to South American Indians by Disability Age Under 5
In terms of disability age under 5, the demographic groups most similar to South American Indians are Central American Indian (1.3%, a difference of 0.20%), Basque (1.3%, a difference of 0.24%), Pueblo (1.3%, a difference of 0.27%), Tongan (1.3%, a difference of 0.53%), and French American Indian (1.3%, a difference of 0.65%).
| Demographics | Rating | Rank | Disability Age Under 5 |
| Immigrants | Costa Rica | 5.5 /100 | #229 | Tragic 1.3% |
| Lebanese | 5.3 /100 | #230 | Tragic 1.3% |
| Immigrants | Northern Europe | 4.7 /100 | #231 | Tragic 1.3% |
| French American Indians | 4.5 /100 | #232 | Tragic 1.3% |
| Tongans | 4.2 /100 | #233 | Tragic 1.3% |
| Pueblo | 3.8 /100 | #234 | Tragic 1.3% |
| Central American Indians | 3.6 /100 | #235 | Tragic 1.3% |
| South American Indians | 3.3 /100 | #236 | Tragic 1.3% |
| Basques | 3.0 /100 | #237 | Tragic 1.3% |
| Spanish American Indians | 2.4 /100 | #238 | Tragic 1.3% |
| Immigrants | Austria | 2.3 /100 | #239 | Tragic 1.3% |
| Native Hawaiians | 2.2 /100 | #240 | Tragic 1.3% |
| Maltese | 2.2 /100 | #241 | Tragic 1.3% |
| Lumbee | 2.1 /100 | #242 | Tragic 1.3% |
| Immigrants | Cameroon | 1.7 /100 | #243 | Tragic 1.4% |