Dutch West Indian vs Immigrants from Guatemala Male Unemployment
COMPARE
Dutch West Indian
Immigrants from Guatemala
Male Unemployment
Male Unemployment Comparison
Dutch West Indians
Immigrants from Guatemala
5.8%
MALE UNEMPLOYMENT
0.1/ 100
METRIC RATING
258th/ 347
METRIC RANK
5.6%
MALE UNEMPLOYMENT
1.1/ 100
METRIC RATING
239th/ 347
METRIC RANK
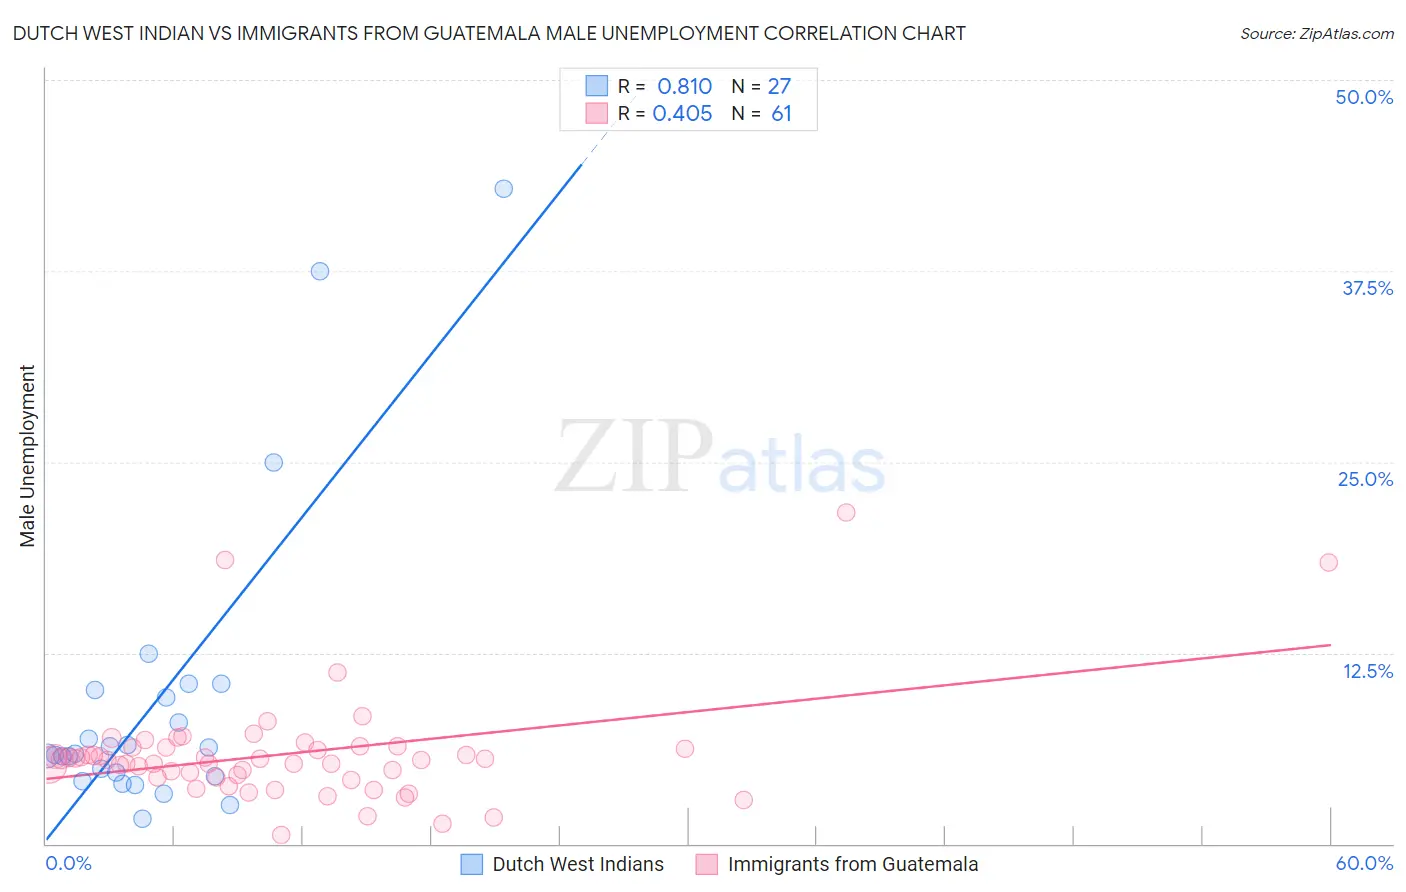
Dutch West Indian vs Immigrants from Guatemala Male Unemployment Correlation Chart
The statistical analysis conducted on geographies consisting of 85,545,191 people shows a very strong positive correlation between the proportion of Dutch West Indians and unemployment rate among males in the United States with a correlation coefficient (R) of 0.810 and weighted average of 5.8%. Similarly, the statistical analysis conducted on geographies consisting of 375,961,027 people shows a moderate positive correlation between the proportion of Immigrants from Guatemala and unemployment rate among males in the United States with a correlation coefficient (R) of 0.405 and weighted average of 5.6%, a difference of 2.9%.
Male Unemployment Correlation Summary
| Measurement | Dutch West Indian | Immigrants from Guatemala |
| Minimum | 1.6% | 0.60% |
| Maximum | 42.9% | 21.7% |
| Range | 41.3% | 21.1% |
| Mean | 9.4% | 5.9% |
| Median | 5.9% | 5.5% |
| Interquartile 25% (IQ1) | 4.4% | 4.3% |
| Interquartile 75% (IQ3) | 10.1% | 6.3% |
| Interquartile Range (IQR) | 5.7% | 1.9% |
| Standard Deviation (Sample) | 9.9% | 3.6% |
| Standard Deviation (Population) | 9.8% | 3.6% |
Demographics Similar to Dutch West Indians and Immigrants from Guatemala by Male Unemployment
In terms of male unemployment, the demographic groups most similar to Dutch West Indians are Hispanic or Latino (5.8%, a difference of 0.14%), Comanche (5.8%, a difference of 0.30%), Kiowa (5.8%, a difference of 0.38%), Japanese (5.8%, a difference of 0.49%), and Mexican American Indian (5.8%, a difference of 0.66%). Similarly, the demographic groups most similar to Immigrants from Guatemala are Native Hawaiian (5.6%, a difference of 0.0%), Immigrants from Cameroon (5.6%, a difference of 0.070%), Salvadoran (5.7%, a difference of 0.11%), Ottawa (5.7%, a difference of 0.18%), and Bangladeshi (5.7%, a difference of 0.47%).
| Demographics | Rating | Rank | Male Unemployment |
| Native Hawaiians | 1.1 /100 | #238 | Tragic 5.6% |
| Immigrants | Guatemala | 1.1 /100 | #239 | Tragic 5.6% |
| Immigrants | Cameroon | 1.0 /100 | #240 | Tragic 5.6% |
| Salvadorans | 1.0 /100 | #241 | Tragic 5.7% |
| Ottawa | 0.9 /100 | #242 | Tragic 5.7% |
| Bangladeshis | 0.8 /100 | #243 | Tragic 5.7% |
| Immigrants | El Salvador | 0.7 /100 | #244 | Tragic 5.7% |
| Yaqui | 0.7 /100 | #245 | Tragic 5.7% |
| Iroquois | 0.6 /100 | #246 | Tragic 5.7% |
| Hawaiians | 0.6 /100 | #247 | Tragic 5.7% |
| Marshallese | 0.5 /100 | #248 | Tragic 5.7% |
| Cree | 0.4 /100 | #249 | Tragic 5.7% |
| Immigrants | Bahamas | 0.4 /100 | #250 | Tragic 5.7% |
| Spanish Americans | 0.3 /100 | #251 | Tragic 5.7% |
| Mexicans | 0.2 /100 | #252 | Tragic 5.8% |
| Mexican American Indians | 0.2 /100 | #253 | Tragic 5.8% |
| Japanese | 0.2 /100 | #254 | Tragic 5.8% |
| Kiowa | 0.2 /100 | #255 | Tragic 5.8% |
| Comanche | 0.2 /100 | #256 | Tragic 5.8% |
| Hispanics or Latinos | 0.1 /100 | #257 | Tragic 5.8% |
| Dutch West Indians | 0.1 /100 | #258 | Tragic 5.8% |