British vs Immigrants from Northern Africa Cognitive Disability
COMPARE
British
Immigrants from Northern Africa
Cognitive Disability
Cognitive Disability Comparison
British
Immigrants from Northern Africa
17.0%
COGNITIVE DISABILITY
89.3/ 100
METRIC RATING
143rd/ 347
METRIC RANK
17.3%
COGNITIVE DISABILITY
50.2/ 100
METRIC RATING
173rd/ 347
METRIC RANK
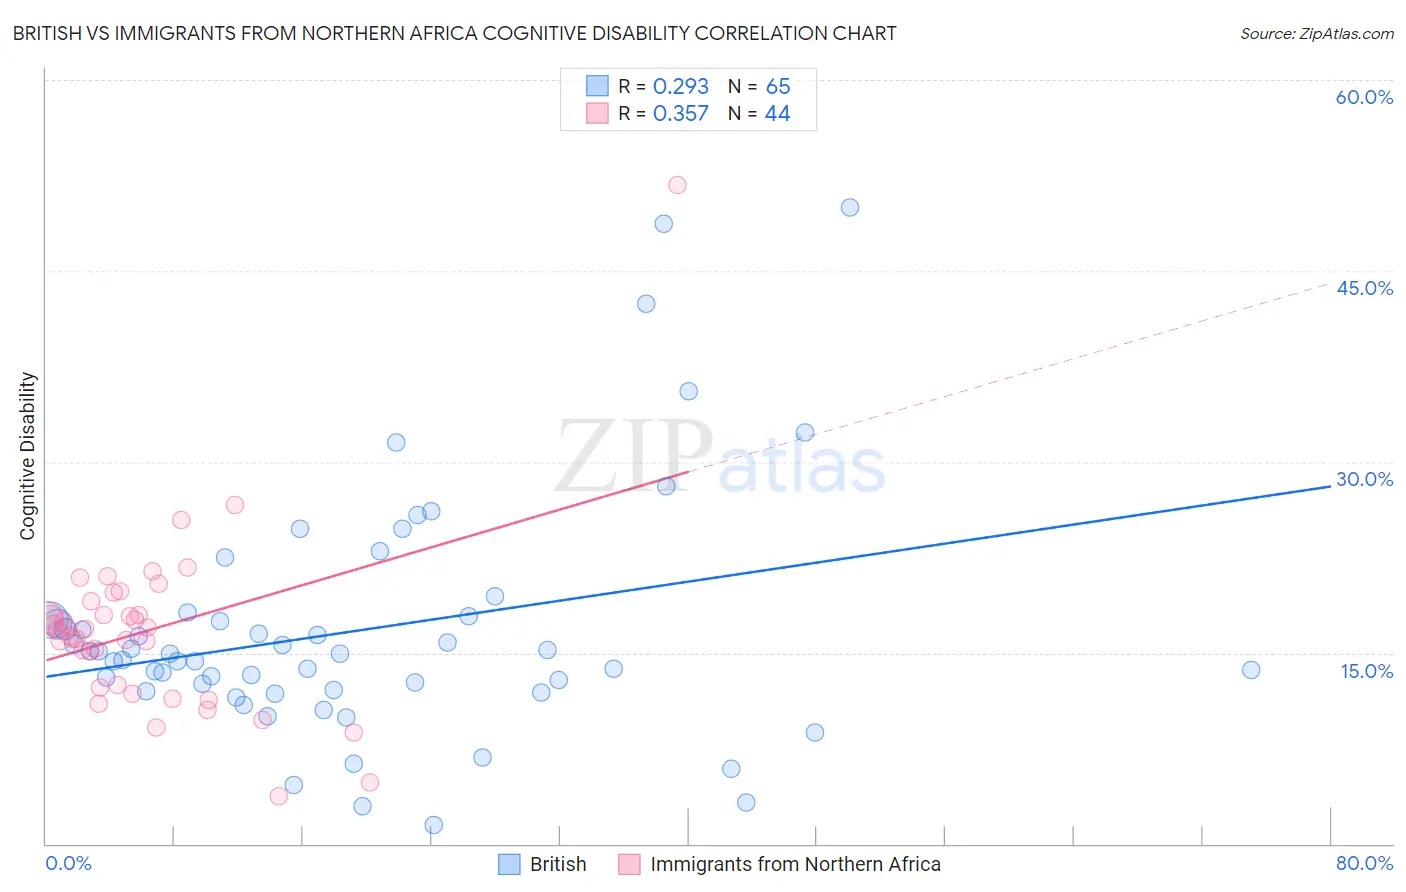
British vs Immigrants from Northern Africa Cognitive Disability Correlation Chart
The statistical analysis conducted on geographies consisting of 531,402,976 people shows a weak positive correlation between the proportion of British and percentage of population with cognitive disability in the United States with a correlation coefficient (R) of 0.293 and weighted average of 17.0%. Similarly, the statistical analysis conducted on geographies consisting of 321,181,244 people shows a mild positive correlation between the proportion of Immigrants from Northern Africa and percentage of population with cognitive disability in the United States with a correlation coefficient (R) of 0.357 and weighted average of 17.3%, a difference of 1.5%.
Cognitive Disability Correlation Summary
| Measurement | British | Immigrants from Northern Africa |
| Minimum | 1.5% | 3.7% |
| Maximum | 50.0% | 51.8% |
| Range | 48.5% | 48.1% |
| Mean | 16.7% | 16.7% |
| Median | 14.9% | 16.8% |
| Interquartile 25% (IQ1) | 12.0% | 12.4% |
| Interquartile 75% (IQ3) | 17.7% | 18.5% |
| Interquartile Range (IQR) | 5.7% | 6.2% |
| Standard Deviation (Sample) | 9.5% | 7.2% |
| Standard Deviation (Population) | 9.4% | 7.1% |
Similar Demographics by Cognitive Disability
Demographics Similar to British by Cognitive Disability
In terms of cognitive disability, the demographic groups most similar to British are Immigrants from Brazil (17.0%, a difference of 0.0%), Carpatho Rusyn (17.0%, a difference of 0.020%), French (17.0%, a difference of 0.050%), Chilean (17.0%, a difference of 0.050%), and Aleut (17.0%, a difference of 0.050%).
| Demographics | Rating | Rank | Cognitive Disability |
| Israelis | 91.0 /100 | #136 | Exceptional 17.0% |
| Immigrants | Norway | 90.9 /100 | #137 | Exceptional 17.0% |
| Welsh | 90.8 /100 | #138 | Exceptional 17.0% |
| French | 90.0 /100 | #139 | Excellent 17.0% |
| Chileans | 89.9 /100 | #140 | Excellent 17.0% |
| Aleuts | 89.9 /100 | #141 | Excellent 17.0% |
| Carpatho Rusyns | 89.6 /100 | #142 | Excellent 17.0% |
| British | 89.3 /100 | #143 | Excellent 17.0% |
| Immigrants | Brazil | 89.3 /100 | #144 | Excellent 17.0% |
| Immigrants | South Eastern Asia | 88.7 /100 | #145 | Excellent 17.0% |
| Costa Ricans | 88.0 /100 | #146 | Excellent 17.0% |
| Scotch-Irish | 85.9 /100 | #147 | Excellent 17.1% |
| French Canadians | 85.7 /100 | #148 | Excellent 17.1% |
| Cypriots | 85.7 /100 | #149 | Excellent 17.1% |
| Basques | 85.5 /100 | #150 | Excellent 17.1% |
Demographics Similar to Immigrants from Northern Africa by Cognitive Disability
In terms of cognitive disability, the demographic groups most similar to Immigrants from Northern Africa are Laotian (17.3%, a difference of 0.010%), Tsimshian (17.3%, a difference of 0.010%), Shoshone (17.3%, a difference of 0.030%), Ute (17.3%, a difference of 0.030%), and Spanish (17.3%, a difference of 0.040%).
| Demographics | Rating | Rank | Cognitive Disability |
| Immigrants | Ecuador | 64.4 /100 | #166 | Good 17.2% |
| Immigrants | Syria | 63.5 /100 | #167 | Good 17.2% |
| Immigrants | Immigrants | 62.5 /100 | #168 | Good 17.2% |
| Immigrants | Portugal | 61.8 /100 | #169 | Good 17.2% |
| Ecuadorians | 59.6 /100 | #170 | Average 17.2% |
| Tlingit-Haida | 59.4 /100 | #171 | Average 17.2% |
| Immigrants | Turkey | 56.7 /100 | #172 | Average 17.2% |
| Immigrants | Northern Africa | 50.2 /100 | #173 | Average 17.3% |
| Laotians | 50.0 /100 | #174 | Average 17.3% |
| Tsimshian | 49.8 /100 | #175 | Average 17.3% |
| Shoshone | 49.2 /100 | #176 | Average 17.3% |
| Ute | 49.1 /100 | #177 | Average 17.3% |
| Spanish | 48.9 /100 | #178 | Average 17.3% |
| Sioux | 48.6 /100 | #179 | Average 17.3% |
| Pakistanis | 43.9 /100 | #180 | Average 17.3% |