Cuban vs Immigrants from Northern Africa Cognitive Disability
COMPARE
Cuban
Immigrants from Northern Africa
Cognitive Disability
Cognitive Disability Comparison
Cubans
Immigrants from Northern Africa
16.5%
COGNITIVE DISABILITY
99.9/ 100
METRIC RATING
41st/ 347
METRIC RANK
17.3%
COGNITIVE DISABILITY
50.2/ 100
METRIC RATING
173rd/ 347
METRIC RANK
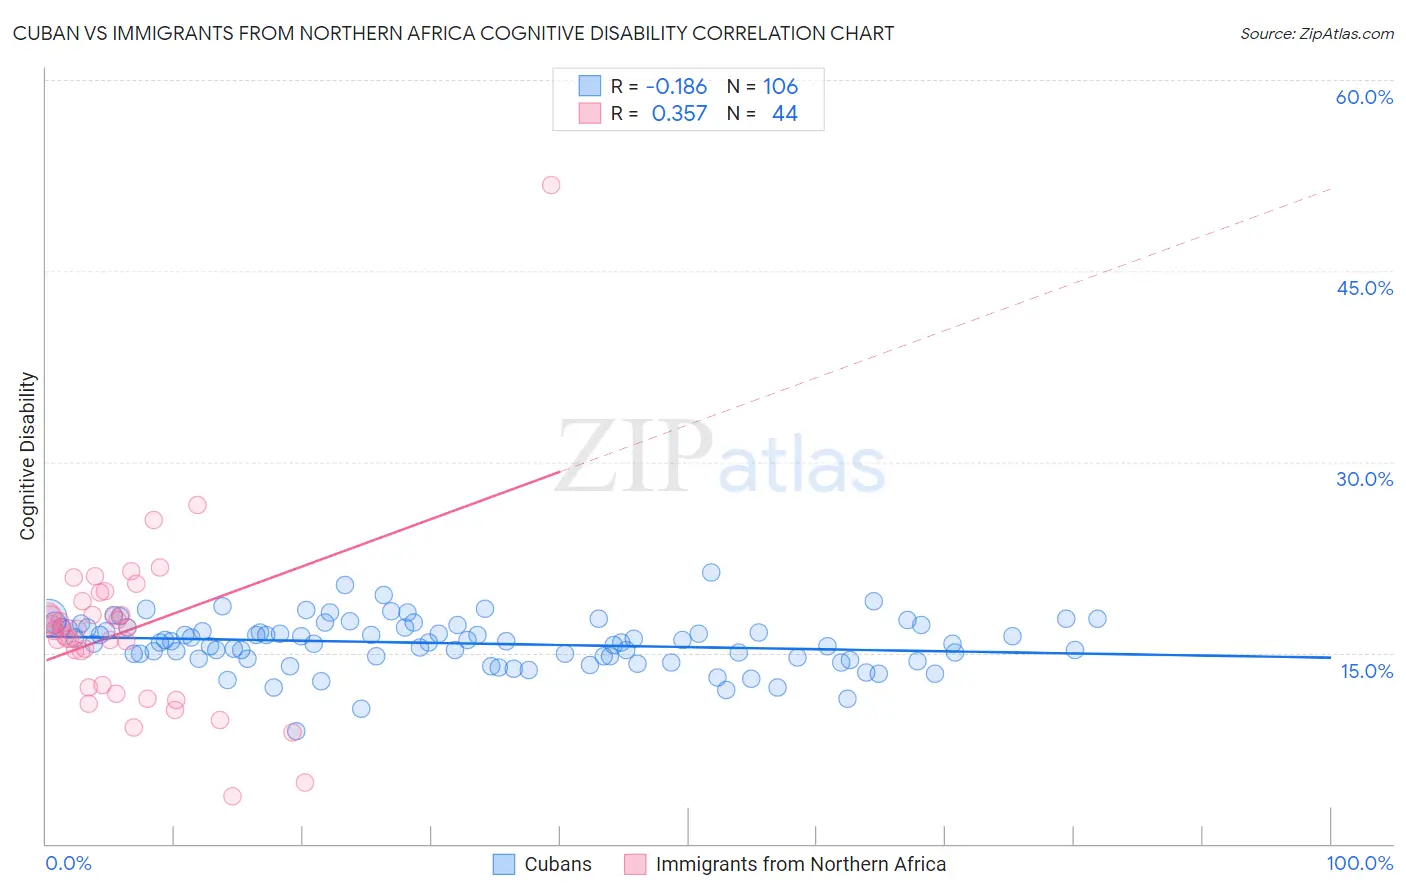
Cuban vs Immigrants from Northern Africa Cognitive Disability Correlation Chart
The statistical analysis conducted on geographies consisting of 449,269,783 people shows a poor negative correlation between the proportion of Cubans and percentage of population with cognitive disability in the United States with a correlation coefficient (R) of -0.186 and weighted average of 16.5%. Similarly, the statistical analysis conducted on geographies consisting of 321,181,244 people shows a mild positive correlation between the proportion of Immigrants from Northern Africa and percentage of population with cognitive disability in the United States with a correlation coefficient (R) of 0.357 and weighted average of 17.3%, a difference of 4.9%.
Cognitive Disability Correlation Summary
| Measurement | Cuban | Immigrants from Northern Africa |
| Minimum | 8.8% | 3.7% |
| Maximum | 21.3% | 51.8% |
| Range | 12.5% | 48.1% |
| Mean | 15.7% | 16.7% |
| Median | 15.9% | 16.8% |
| Interquartile 25% (IQ1) | 14.7% | 12.4% |
| Interquartile 75% (IQ3) | 17.0% | 18.5% |
| Interquartile Range (IQR) | 2.3% | 6.2% |
| Standard Deviation (Sample) | 2.0% | 7.2% |
| Standard Deviation (Population) | 2.0% | 7.1% |
Similar Demographics by Cognitive Disability
Demographics Similar to Cubans by Cognitive Disability
In terms of cognitive disability, the demographic groups most similar to Cubans are Immigrants from Belarus (16.5%, a difference of 0.0%), Hungarian (16.5%, a difference of 0.010%), Bolivian (16.5%, a difference of 0.020%), Immigrants from Canada (16.5%, a difference of 0.080%), and Immigrants from Eastern Europe (16.5%, a difference of 0.090%).
| Demographics | Rating | Rank | Cognitive Disability |
| Russians | 99.9 /100 | #34 | Exceptional 16.4% |
| Slovaks | 99.9 /100 | #35 | Exceptional 16.4% |
| Greeks | 99.9 /100 | #36 | Exceptional 16.4% |
| Slovenes | 99.9 /100 | #37 | Exceptional 16.5% |
| Immigrants | Eastern Europe | 99.9 /100 | #38 | Exceptional 16.5% |
| Bolivians | 99.9 /100 | #39 | Exceptional 16.5% |
| Immigrants | Belarus | 99.9 /100 | #40 | Exceptional 16.5% |
| Cubans | 99.9 /100 | #41 | Exceptional 16.5% |
| Hungarians | 99.9 /100 | #42 | Exceptional 16.5% |
| Immigrants | Canada | 99.8 /100 | #43 | Exceptional 16.5% |
| Macedonians | 99.8 /100 | #44 | Exceptional 16.5% |
| Immigrants | Europe | 99.8 /100 | #45 | Exceptional 16.5% |
| Immigrants | Colombia | 99.8 /100 | #46 | Exceptional 16.5% |
| Immigrants | Italy | 99.8 /100 | #47 | Exceptional 16.5% |
| Immigrants | North America | 99.8 /100 | #48 | Exceptional 16.5% |
Demographics Similar to Immigrants from Northern Africa by Cognitive Disability
In terms of cognitive disability, the demographic groups most similar to Immigrants from Northern Africa are Laotian (17.3%, a difference of 0.010%), Tsimshian (17.3%, a difference of 0.010%), Shoshone (17.3%, a difference of 0.030%), Ute (17.3%, a difference of 0.030%), and Spanish (17.3%, a difference of 0.040%).
| Demographics | Rating | Rank | Cognitive Disability |
| Immigrants | Ecuador | 64.4 /100 | #166 | Good 17.2% |
| Immigrants | Syria | 63.5 /100 | #167 | Good 17.2% |
| Immigrants | Immigrants | 62.5 /100 | #168 | Good 17.2% |
| Immigrants | Portugal | 61.8 /100 | #169 | Good 17.2% |
| Ecuadorians | 59.6 /100 | #170 | Average 17.2% |
| Tlingit-Haida | 59.4 /100 | #171 | Average 17.2% |
| Immigrants | Turkey | 56.7 /100 | #172 | Average 17.2% |
| Immigrants | Northern Africa | 50.2 /100 | #173 | Average 17.3% |
| Laotians | 50.0 /100 | #174 | Average 17.3% |
| Tsimshian | 49.8 /100 | #175 | Average 17.3% |
| Shoshone | 49.2 /100 | #176 | Average 17.3% |
| Ute | 49.1 /100 | #177 | Average 17.3% |
| Spanish | 48.9 /100 | #178 | Average 17.3% |
| Sioux | 48.6 /100 | #179 | Average 17.3% |
| Pakistanis | 43.9 /100 | #180 | Average 17.3% |