Dominican vs Immigrants from Grenada Unemployment Among Ages 60 to 64 years
COMPARE
Dominican
Immigrants from Grenada
Unemployment Among Ages 60 to 64 years
Unemployment Among Ages 60 to 64 years Comparison
Dominicans
Immigrants from Grenada
6.0%
UNEMPLOYMENT AMONG AGES 60 TO 64 YEARS
0.0/ 100
METRIC RATING
332nd/ 347
METRIC RANK
5.9%
UNEMPLOYMENT AMONG AGES 60 TO 64 YEARS
0.0/ 100
METRIC RATING
327th/ 347
METRIC RANK
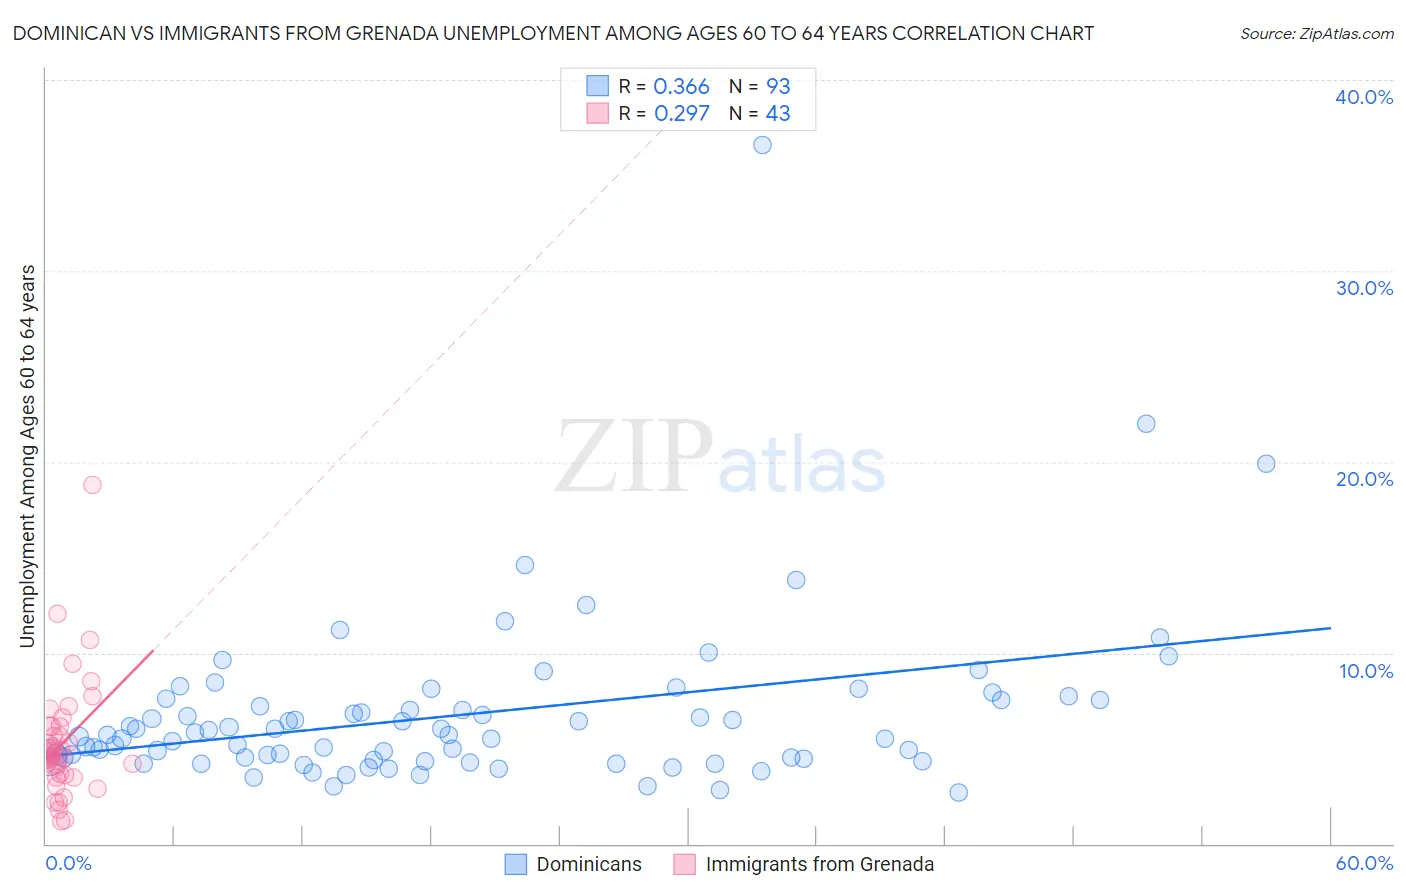
Dominican vs Immigrants from Grenada Unemployment Among Ages 60 to 64 years Correlation Chart
The statistical analysis conducted on geographies consisting of 324,520,720 people shows a mild positive correlation between the proportion of Dominicans and unemployment rate among population between the ages 60 and 64 in the United States with a correlation coefficient (R) of 0.366 and weighted average of 6.0%. Similarly, the statistical analysis conducted on geographies consisting of 65,525,212 people shows a weak positive correlation between the proportion of Immigrants from Grenada and unemployment rate among population between the ages 60 and 64 in the United States with a correlation coefficient (R) of 0.297 and weighted average of 5.9%, a difference of 1.8%.
Unemployment Among Ages 60 to 64 years Correlation Summary
| Measurement | Dominican | Immigrants from Grenada |
| Minimum | 2.7% | 1.2% |
| Maximum | 36.6% | 18.8% |
| Range | 33.9% | 17.6% |
| Mean | 6.8% | 5.3% |
| Median | 5.7% | 4.6% |
| Interquartile 25% (IQ1) | 4.5% | 3.6% |
| Interquartile 75% (IQ3) | 7.5% | 6.1% |
| Interquartile Range (IQR) | 3.0% | 2.5% |
| Standard Deviation (Sample) | 4.5% | 3.1% |
| Standard Deviation (Population) | 4.4% | 3.1% |
Demographics Similar to Dominicans and Immigrants from Grenada by Unemployment Among Ages 60 to 64 years
In terms of unemployment among ages 60 to 64 years, the demographic groups most similar to Dominicans are Yakama (6.0%, a difference of 0.020%), Immigrants from Armenia (6.0%, a difference of 0.16%), Immigrants from Dominican Republic (6.0%, a difference of 0.35%), Immigrants from Bangladesh (6.0%, a difference of 0.42%), and Apache (6.0%, a difference of 0.43%). Similarly, the demographic groups most similar to Immigrants from Grenada are Immigrants from St. Vincent and the Grenadines (5.9%, a difference of 0.060%), Paiute (5.8%, a difference of 1.0%), Immigrants from Ecuador (5.8%, a difference of 1.0%), Alsatian (5.8%, a difference of 1.4%), and Apache (6.0%, a difference of 1.4%).
| Demographics | Rating | Rank | Unemployment Among Ages 60 to 64 years |
| Immigrants | Belize | 0.0 /100 | #319 | Tragic 5.7% |
| Colville | 0.0 /100 | #320 | Tragic 5.7% |
| Dutch West Indians | 0.0 /100 | #321 | Tragic 5.7% |
| Ecuadorians | 0.0 /100 | #322 | Tragic 5.8% |
| Alsatians | 0.0 /100 | #323 | Tragic 5.8% |
| Immigrants | Ecuador | 0.0 /100 | #324 | Tragic 5.8% |
| Paiute | 0.0 /100 | #325 | Tragic 5.8% |
| Immigrants | St. Vincent and the Grenadines | 0.0 /100 | #326 | Tragic 5.9% |
| Immigrants | Grenada | 0.0 /100 | #327 | Tragic 5.9% |
| Apache | 0.0 /100 | #328 | Tragic 6.0% |
| Immigrants | Bangladesh | 0.0 /100 | #329 | Tragic 6.0% |
| Immigrants | Armenia | 0.0 /100 | #330 | Tragic 6.0% |
| Yakama | 0.0 /100 | #331 | Tragic 6.0% |
| Dominicans | 0.0 /100 | #332 | Tragic 6.0% |
| Immigrants | Dominican Republic | 0.0 /100 | #333 | Tragic 6.0% |
| Puerto Ricans | 0.0 /100 | #334 | Tragic 6.1% |
| Vietnamese | 0.0 /100 | #335 | Tragic 6.1% |
| Kiowa | 0.0 /100 | #336 | Tragic 6.2% |
| Navajo | 0.0 /100 | #337 | Tragic 6.3% |
| Arapaho | 0.0 /100 | #338 | Tragic 6.3% |
| Tlingit-Haida | 0.0 /100 | #339 | Tragic 6.4% |