Delaware vs Immigrants from France Disability Age Over 75
COMPARE
Delaware
Immigrants from France
Disability Age Over 75
Disability Age Over 75 Comparison
Delaware
Immigrants from France
47.5%
DISABILITY AGE OVER 75
39.1/ 100
METRIC RATING
183rd/ 347
METRIC RANK
45.8%
DISABILITY AGE OVER 75
99.7/ 100
METRIC RATING
52nd/ 347
METRIC RANK
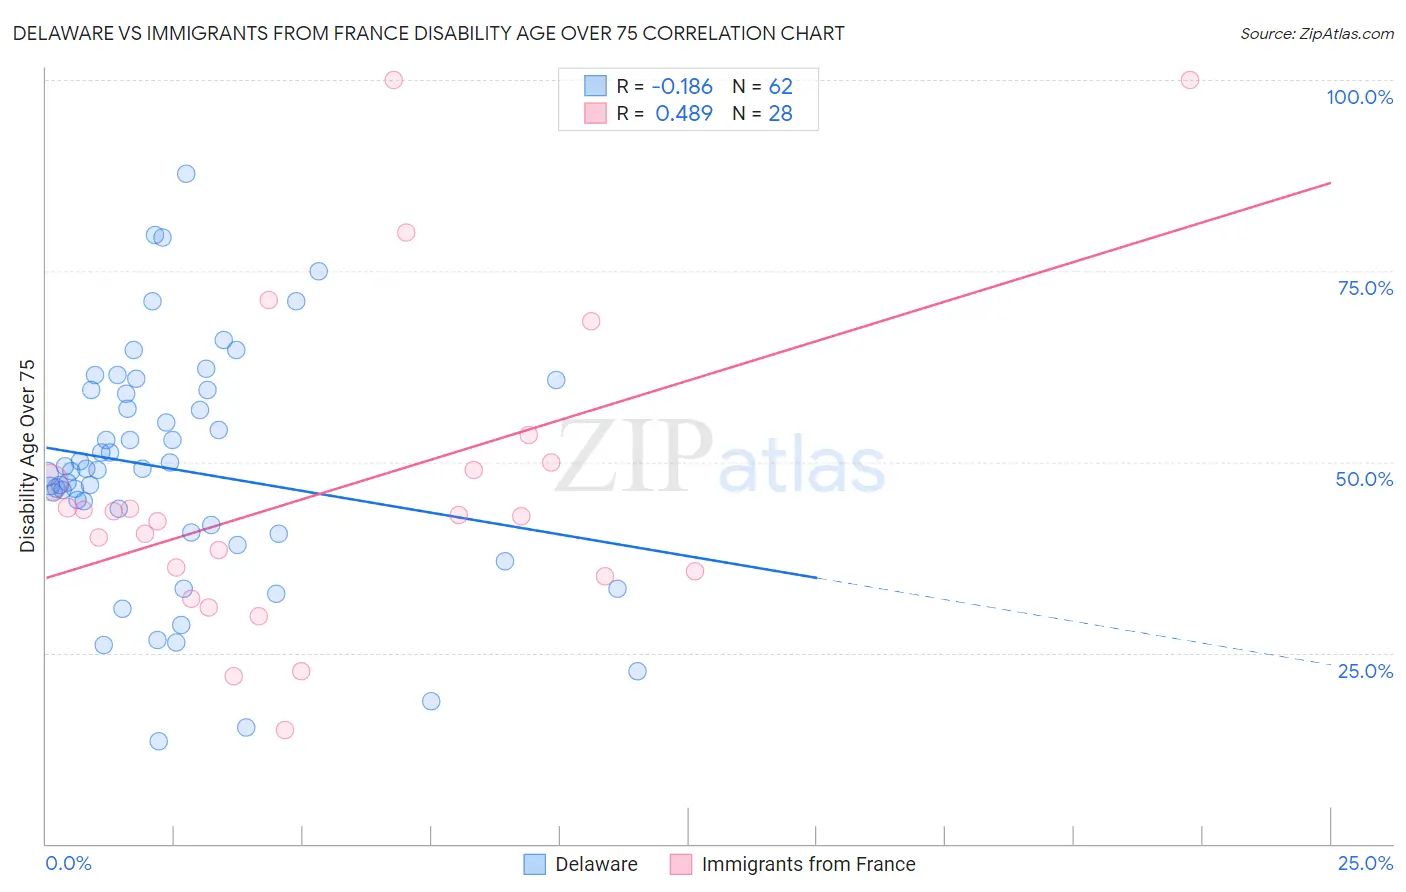
Delaware vs Immigrants from France Disability Age Over 75 Correlation Chart
The statistical analysis conducted on geographies consisting of 96,205,722 people shows a poor negative correlation between the proportion of Delaware and percentage of population with a disability over the age of 75 in the United States with a correlation coefficient (R) of -0.186 and weighted average of 47.5%. Similarly, the statistical analysis conducted on geographies consisting of 287,676,099 people shows a moderate positive correlation between the proportion of Immigrants from France and percentage of population with a disability over the age of 75 in the United States with a correlation coefficient (R) of 0.489 and weighted average of 45.8%, a difference of 3.6%.
Disability Age Over 75 Correlation Summary
| Measurement | Delaware | Immigrants from France |
| Minimum | 13.3% | 15.0% |
| Maximum | 87.7% | 100.0% |
| Range | 74.4% | 85.0% |
| Mean | 49.0% | 46.5% |
| Median | 49.0% | 43.0% |
| Interquartile 25% (IQ1) | 40.8% | 35.4% |
| Interquartile 75% (IQ3) | 59.4% | 49.5% |
| Interquartile Range (IQR) | 18.6% | 14.1% |
| Standard Deviation (Sample) | 15.5% | 20.6% |
| Standard Deviation (Population) | 15.4% | 20.2% |
Similar Demographics by Disability Age Over 75
Demographics Similar to Delaware by Disability Age Over 75
In terms of disability age over 75, the demographic groups most similar to Delaware are Immigrants from Moldova (47.4%, a difference of 0.020%), Immigrants from Kazakhstan (47.4%, a difference of 0.030%), Sierra Leonean (47.4%, a difference of 0.060%), Immigrants from Ecuador (47.4%, a difference of 0.060%), and Cuban (47.4%, a difference of 0.070%).
| Demographics | Rating | Rank | Disability Age Over 75 |
| Ecuadorians | 46.7 /100 | #176 | Average 47.4% |
| Haitians | 44.6 /100 | #177 | Average 47.4% |
| Cubans | 42.1 /100 | #178 | Average 47.4% |
| Sierra Leoneans | 41.7 /100 | #179 | Average 47.4% |
| Immigrants | Ecuador | 41.7 /100 | #180 | Average 47.4% |
| Immigrants | Kazakhstan | 40.4 /100 | #181 | Average 47.4% |
| Immigrants | Moldova | 39.9 /100 | #182 | Fair 47.4% |
| Delaware | 39.1 /100 | #183 | Fair 47.5% |
| Immigrants | Nigeria | 34.0 /100 | #184 | Fair 47.5% |
| Ghanaians | 33.0 /100 | #185 | Fair 47.5% |
| Sudanese | 32.0 /100 | #186 | Fair 47.5% |
| Immigrants | Sudan | 31.8 /100 | #187 | Fair 47.5% |
| Basques | 30.9 /100 | #188 | Fair 47.6% |
| Immigrants | Kenya | 30.8 /100 | #189 | Fair 47.6% |
| Somalis | 29.5 /100 | #190 | Fair 47.6% |
Demographics Similar to Immigrants from France by Disability Age Over 75
In terms of disability age over 75, the demographic groups most similar to Immigrants from France are Immigrants from Italy (45.8%, a difference of 0.020%), Belgian (45.8%, a difference of 0.050%), Immigrants from Korea (45.8%, a difference of 0.050%), Slovak (45.8%, a difference of 0.090%), and Maltese (45.8%, a difference of 0.10%).
| Demographics | Rating | Rank | Disability Age Over 75 |
| Turks | 99.8 /100 | #45 | Exceptional 45.7% |
| Swedes | 99.8 /100 | #46 | Exceptional 45.7% |
| Immigrants | Canada | 99.8 /100 | #47 | Exceptional 45.7% |
| Croatians | 99.8 /100 | #48 | Exceptional 45.7% |
| Immigrants | North America | 99.8 /100 | #49 | Exceptional 45.7% |
| Belgians | 99.7 /100 | #50 | Exceptional 45.8% |
| Immigrants | Korea | 99.7 /100 | #51 | Exceptional 45.8% |
| Immigrants | France | 99.7 /100 | #52 | Exceptional 45.8% |
| Immigrants | Italy | 99.7 /100 | #53 | Exceptional 45.8% |
| Slovaks | 99.6 /100 | #54 | Exceptional 45.8% |
| Maltese | 99.6 /100 | #55 | Exceptional 45.8% |
| Immigrants | Netherlands | 99.6 /100 | #56 | Exceptional 45.9% |
| Immigrants | Turkey | 99.6 /100 | #57 | Exceptional 45.9% |
| Immigrants | Israel | 99.6 /100 | #58 | Exceptional 45.9% |
| Iranians | 99.6 /100 | #59 | Exceptional 45.9% |