Sierra Leonean vs Immigrants from England Disability Age 65 to 74
COMPARE
Sierra Leonean
Immigrants from England
Disability Age 65 to 74
Disability Age 65 to 74 Comparison
Sierra Leoneans
Immigrants from England
23.2%
DISABILITY AGE 65 TO 74
60.9/ 100
METRIC RATING
164th/ 347
METRIC RANK
22.2%
DISABILITY AGE 65 TO 74
96.5/ 100
METRIC RATING
101st/ 347
METRIC RANK
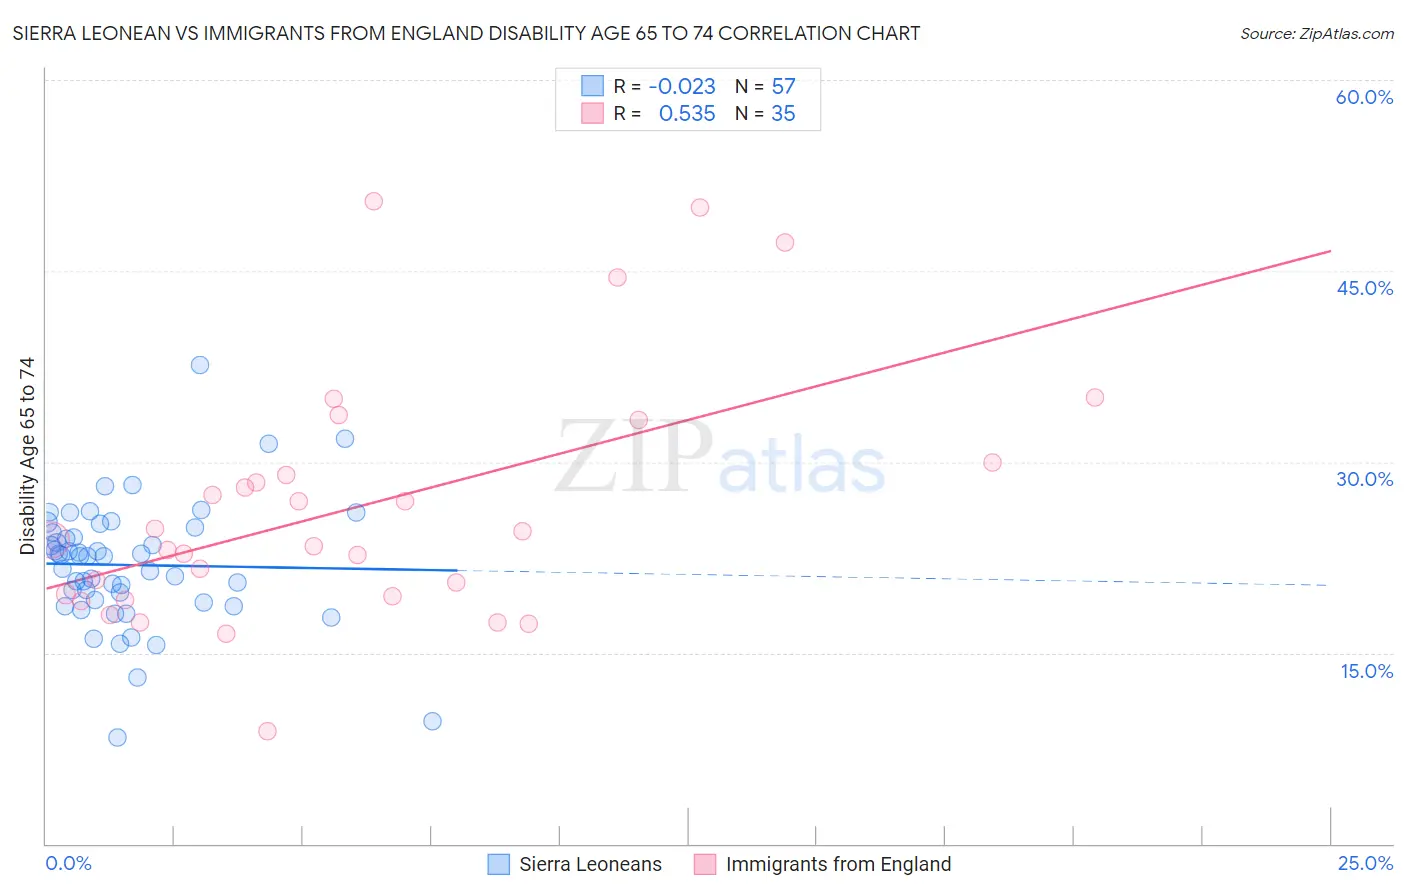
Sierra Leonean vs Immigrants from England Disability Age 65 to 74 Correlation Chart
The statistical analysis conducted on geographies consisting of 83,282,837 people shows no correlation between the proportion of Sierra Leoneans and percentage of population with a disability between the ages 65 and 75 in the United States with a correlation coefficient (R) of -0.023 and weighted average of 23.2%. Similarly, the statistical analysis conducted on geographies consisting of 391,407,764 people shows a substantial positive correlation between the proportion of Immigrants from England and percentage of population with a disability between the ages 65 and 75 in the United States with a correlation coefficient (R) of 0.535 and weighted average of 22.2%, a difference of 4.4%.
Disability Age 65 to 74 Correlation Summary
| Measurement | Sierra Leonean | Immigrants from England |
| Minimum | 8.4% | 8.8% |
| Maximum | 37.6% | 50.5% |
| Range | 29.2% | 41.7% |
| Mean | 21.9% | 26.5% |
| Median | 22.6% | 23.9% |
| Interquartile 25% (IQ1) | 19.0% | 19.4% |
| Interquartile 75% (IQ3) | 24.6% | 30.0% |
| Interquartile Range (IQR) | 5.6% | 10.6% |
| Standard Deviation (Sample) | 4.9% | 9.8% |
| Standard Deviation (Population) | 4.9% | 9.6% |
Similar Demographics by Disability Age 65 to 74
Demographics Similar to Sierra Leoneans by Disability Age 65 to 74
In terms of disability age 65 to 74, the demographic groups most similar to Sierra Leoneans are Immigrants from Philippines (23.2%, a difference of 0.010%), Vietnamese (23.2%, a difference of 0.010%), European (23.2%, a difference of 0.020%), Immigrants from Afghanistan (23.2%, a difference of 0.020%), and Immigrants from Cameroon (23.1%, a difference of 0.18%).
| Demographics | Rating | Rank | Disability Age 65 to 74 |
| Czechoslovakians | 72.4 /100 | #157 | Good 23.0% |
| Immigrants | Vietnam | 69.1 /100 | #158 | Good 23.1% |
| South American Indians | 65.5 /100 | #159 | Good 23.1% |
| Koreans | 64.2 /100 | #160 | Good 23.1% |
| Immigrants | Cameroon | 63.8 /100 | #161 | Good 23.1% |
| Europeans | 61.2 /100 | #162 | Good 23.2% |
| Immigrants | Philippines | 61.1 /100 | #163 | Good 23.2% |
| Sierra Leoneans | 60.9 /100 | #164 | Good 23.2% |
| Vietnamese | 60.8 /100 | #165 | Good 23.2% |
| Immigrants | Afghanistan | 60.5 /100 | #166 | Good 23.2% |
| Immigrants | Bosnia and Herzegovina | 57.6 /100 | #167 | Average 23.2% |
| Pakistanis | 57.0 /100 | #168 | Average 23.2% |
| Icelanders | 54.3 /100 | #169 | Average 23.3% |
| Moroccans | 54.2 /100 | #170 | Average 23.3% |
| Cubans | 51.9 /100 | #171 | Average 23.3% |
Demographics Similar to Immigrants from England by Disability Age 65 to 74
In terms of disability age 65 to 74, the demographic groups most similar to Immigrants from England are Uruguayan (22.2%, a difference of 0.020%), Immigrants from Saudi Arabia (22.2%, a difference of 0.020%), South American (22.2%, a difference of 0.050%), Colombian (22.2%, a difference of 0.060%), and Palestinian (22.2%, a difference of 0.10%).
| Demographics | Rating | Rank | Disability Age 65 to 74 |
| Immigrants | Chile | 97.7 /100 | #94 | Exceptional 22.1% |
| Romanians | 97.7 /100 | #95 | Exceptional 22.1% |
| Immigrants | North America | 97.5 /100 | #96 | Exceptional 22.1% |
| Immigrants | Southern Europe | 97.2 /100 | #97 | Exceptional 22.1% |
| Jordanians | 96.9 /100 | #98 | Exceptional 22.2% |
| Immigrants | Colombia | 96.8 /100 | #99 | Exceptional 22.2% |
| Uruguayans | 96.5 /100 | #100 | Exceptional 22.2% |
| Immigrants | England | 96.5 /100 | #101 | Exceptional 22.2% |
| Immigrants | Saudi Arabia | 96.4 /100 | #102 | Exceptional 22.2% |
| South Americans | 96.4 /100 | #103 | Exceptional 22.2% |
| Colombians | 96.4 /100 | #104 | Exceptional 22.2% |
| Palestinians | 96.3 /100 | #105 | Exceptional 22.2% |
| Peruvians | 96.1 /100 | #106 | Exceptional 22.2% |
| Slovenes | 96.1 /100 | #107 | Exceptional 22.2% |
| Immigrants | Zimbabwe | 96.1 /100 | #108 | Exceptional 22.3% |