Tsimshian vs Ute Cognitive Disability
COMPARE
Tsimshian
Ute
Cognitive Disability
Cognitive Disability Comparison
Tsimshian
Ute
17.3%
COGNITIVE DISABILITY
49.8/ 100
METRIC RATING
175th/ 347
METRIC RANK
17.3%
COGNITIVE DISABILITY
49.1/ 100
METRIC RATING
177th/ 347
METRIC RANK
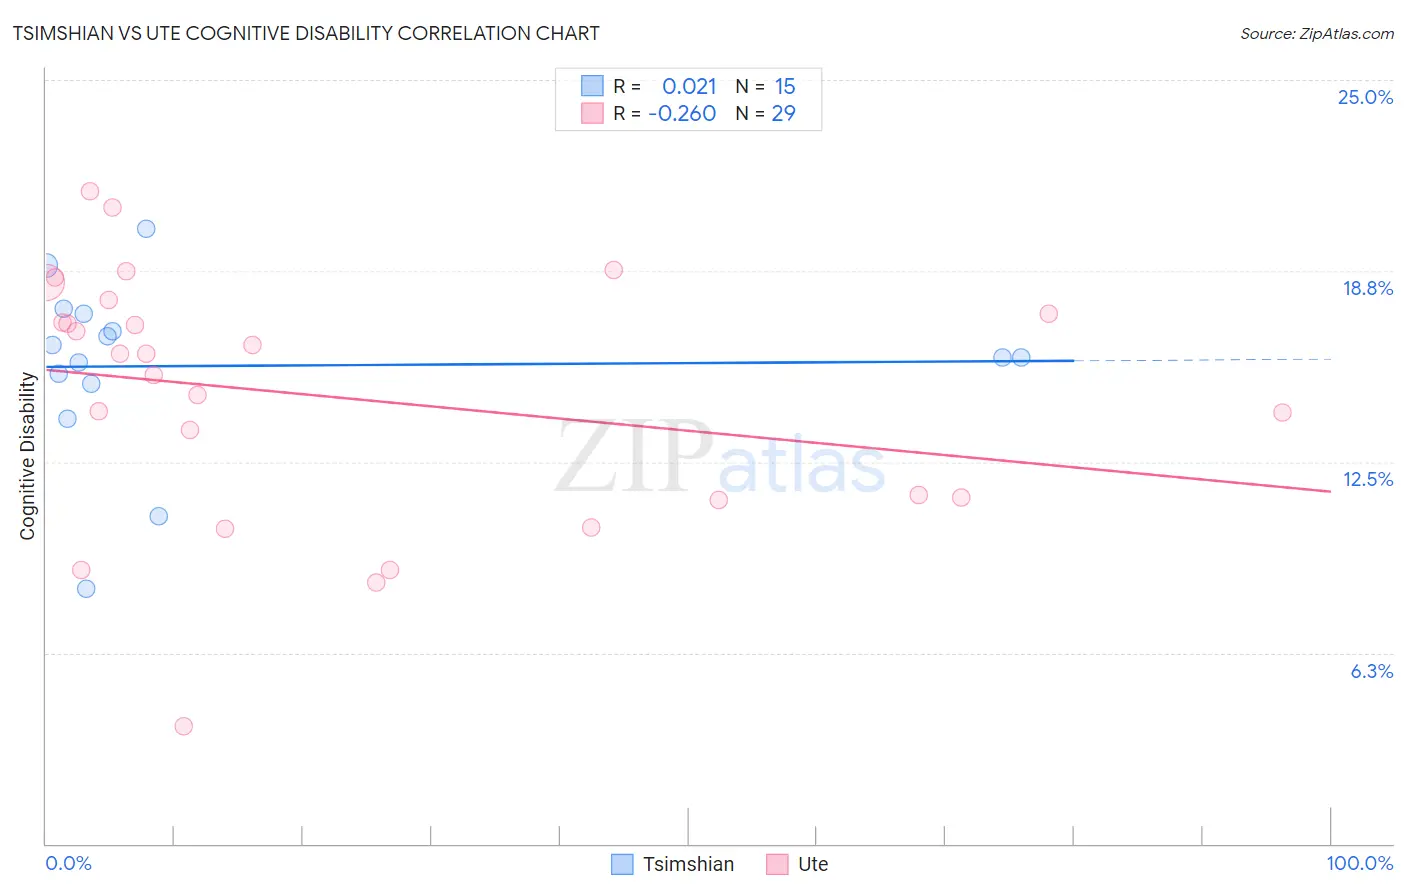
Tsimshian vs Ute Cognitive Disability Correlation Chart
The statistical analysis conducted on geographies consisting of 15,626,544 people shows no correlation between the proportion of Tsimshian and percentage of population with cognitive disability in the United States with a correlation coefficient (R) of 0.021 and weighted average of 17.3%. Similarly, the statistical analysis conducted on geographies consisting of 55,658,356 people shows a weak negative correlation between the proportion of Ute and percentage of population with cognitive disability in the United States with a correlation coefficient (R) of -0.260 and weighted average of 17.3%, a difference of 0.020%.
Cognitive Disability Correlation Summary
| Measurement | Tsimshian | Ute |
| Minimum | 8.4% | 3.9% |
| Maximum | 20.1% | 21.4% |
| Range | 11.8% | 17.5% |
| Mean | 15.6% | 14.6% |
| Median | 15.9% | 16.0% |
| Interquartile 25% (IQ1) | 15.1% | 11.3% |
| Interquartile 75% (IQ3) | 17.3% | 17.6% |
| Interquartile Range (IQR) | 2.3% | 6.3% |
| Standard Deviation (Sample) | 2.9% | 4.1% |
| Standard Deviation (Population) | 2.8% | 4.1% |
Demographics Similar to Tsimshian and Ute by Cognitive Disability
In terms of cognitive disability, the demographic groups most similar to Tsimshian are Immigrants from Northern Africa (17.3%, a difference of 0.010%), Laotian (17.3%, a difference of 0.010%), Shoshone (17.3%, a difference of 0.020%), Spanish (17.3%, a difference of 0.020%), and Sioux (17.3%, a difference of 0.030%). Similarly, the demographic groups most similar to Ute are Shoshone (17.3%, a difference of 0.0%), Spanish (17.3%, a difference of 0.0%), Sioux (17.3%, a difference of 0.010%), Immigrants from Northern Africa (17.3%, a difference of 0.030%), and Laotian (17.3%, a difference of 0.030%).
| Demographics | Rating | Rank | Cognitive Disability |
| Immigrants | Ecuador | 64.4 /100 | #166 | Good 17.2% |
| Immigrants | Syria | 63.5 /100 | #167 | Good 17.2% |
| Immigrants | Immigrants | 62.5 /100 | #168 | Good 17.2% |
| Immigrants | Portugal | 61.8 /100 | #169 | Good 17.2% |
| Ecuadorians | 59.6 /100 | #170 | Average 17.2% |
| Tlingit-Haida | 59.4 /100 | #171 | Average 17.2% |
| Immigrants | Turkey | 56.7 /100 | #172 | Average 17.2% |
| Immigrants | Northern Africa | 50.2 /100 | #173 | Average 17.3% |
| Laotians | 50.0 /100 | #174 | Average 17.3% |
| Tsimshian | 49.8 /100 | #175 | Average 17.3% |
| Shoshone | 49.2 /100 | #176 | Average 17.3% |
| Ute | 49.1 /100 | #177 | Average 17.3% |
| Spanish | 48.9 /100 | #178 | Average 17.3% |
| Sioux | 48.6 /100 | #179 | Average 17.3% |
| Pakistanis | 43.9 /100 | #180 | Average 17.3% |
| Immigrants | Guyana | 42.9 /100 | #181 | Average 17.3% |
| Arabs | 42.8 /100 | #182 | Average 17.3% |
| Spaniards | 40.3 /100 | #183 | Average 17.3% |
| Crow | 39.1 /100 | #184 | Fair 17.3% |
| Afghans | 38.2 /100 | #185 | Fair 17.3% |
| Cambodians | 35.9 /100 | #186 | Fair 17.3% |