Czechoslovakian vs Sudanese College, 1 year or more
COMPARE
Czechoslovakian
Sudanese
College, 1 year or more
College, 1 year or more Comparison
Czechoslovakians
Sudanese
59.4%
COLLEGE, 1 YEAR OR MORE
48.3/ 100
METRIC RATING
178th/ 347
METRIC RANK
60.2%
COLLEGE, 1 YEAR OR MORE
73.0/ 100
METRIC RATING
154th/ 347
METRIC RANK
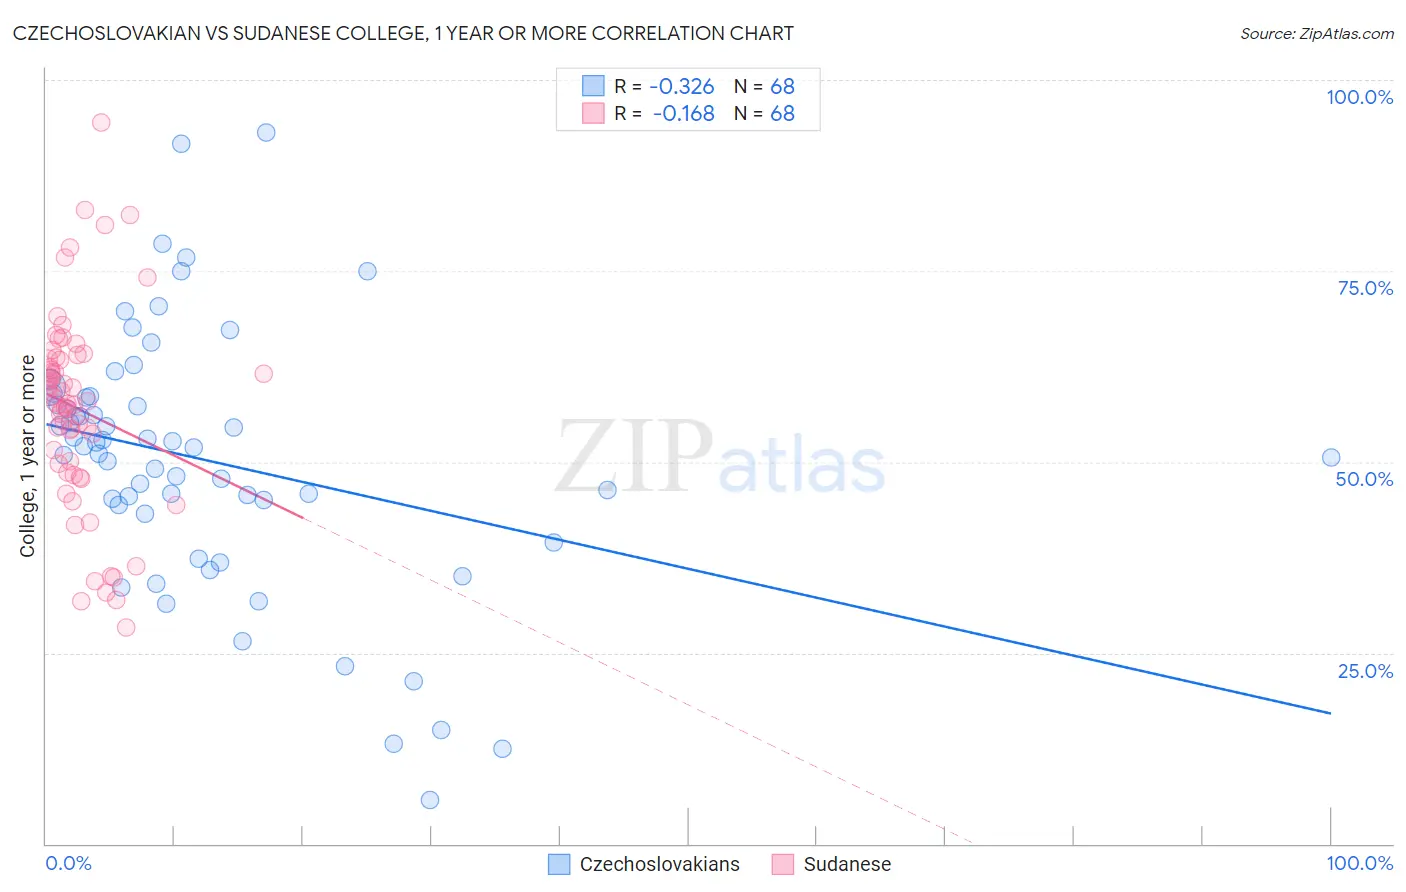
Czechoslovakian vs Sudanese College, 1 year or more Correlation Chart
The statistical analysis conducted on geographies consisting of 368,667,186 people shows a mild negative correlation between the proportion of Czechoslovakians and percentage of population with at least college, 1 year or more education in the United States with a correlation coefficient (R) of -0.326 and weighted average of 59.4%. Similarly, the statistical analysis conducted on geographies consisting of 110,147,806 people shows a poor negative correlation between the proportion of Sudanese and percentage of population with at least college, 1 year or more education in the United States with a correlation coefficient (R) of -0.168 and weighted average of 60.2%, a difference of 1.4%.
College, 1 year or more Correlation Summary
| Measurement | Czechoslovakian | Sudanese |
| Minimum | 5.7% | 28.3% |
| Maximum | 93.1% | 94.5% |
| Range | 87.4% | 66.2% |
| Mean | 50.2% | 56.9% |
| Median | 52.0% | 57.9% |
| Interquartile 25% (IQ1) | 43.7% | 49.2% |
| Interquartile 75% (IQ3) | 58.5% | 63.6% |
| Interquartile Range (IQR) | 14.7% | 14.4% |
| Standard Deviation (Sample) | 17.1% | 13.1% |
| Standard Deviation (Population) | 16.9% | 13.0% |
Similar Demographics by College, 1 year or more
Demographics Similar to Czechoslovakians by College, 1 year or more
In terms of college, 1 year or more, the demographic groups most similar to Czechoslovakians are Tlingit-Haida (59.4%, a difference of 0.0%), Immigrants from Poland (59.4%, a difference of 0.030%), Sri Lankan (59.4%, a difference of 0.040%), Celtic (59.4%, a difference of 0.090%), and Bermudan (59.3%, a difference of 0.090%).
| Demographics | Rating | Rank | College, 1 year or more |
| Immigrants | Albania | 52.3 /100 | #171 | Average 59.5% |
| Immigrants | Sierra Leone | 52.2 /100 | #172 | Average 59.5% |
| Immigrants | Oceania | 51.2 /100 | #173 | Average 59.4% |
| Celtics | 50.0 /100 | #174 | Average 59.4% |
| Sri Lankans | 49.0 /100 | #175 | Average 59.4% |
| Immigrants | Poland | 48.9 /100 | #176 | Average 59.4% |
| Tlingit-Haida | 48.4 /100 | #177 | Average 59.4% |
| Czechoslovakians | 48.3 /100 | #178 | Average 59.4% |
| Bermudans | 46.6 /100 | #179 | Average 59.3% |
| Yugoslavians | 44.1 /100 | #180 | Average 59.2% |
| Swiss | 43.4 /100 | #181 | Average 59.2% |
| Immigrants | Bosnia and Herzegovina | 42.8 /100 | #182 | Average 59.2% |
| German Russians | 39.3 /100 | #183 | Fair 59.1% |
| Spaniards | 38.3 /100 | #184 | Fair 59.0% |
| South Americans | 35.9 /100 | #185 | Fair 59.0% |
Demographics Similar to Sudanese by College, 1 year or more
In terms of college, 1 year or more, the demographic groups most similar to Sudanese are Moroccan (60.2%, a difference of 0.0%), Finnish (60.2%, a difference of 0.0%), Sierra Leonean (60.2%, a difference of 0.080%), Immigrants from Germany (60.3%, a difference of 0.22%), and Immigrants from Armenia (60.0%, a difference of 0.26%).
| Demographics | Rating | Rank | College, 1 year or more |
| Immigrants | Kenya | 79.1 /100 | #147 | Good 60.5% |
| Kenyans | 79.0 /100 | #148 | Good 60.5% |
| Brazilians | 79.0 /100 | #149 | Good 60.5% |
| Immigrants | Sudan | 77.8 /100 | #150 | Good 60.4% |
| Albanians | 77.8 /100 | #151 | Good 60.4% |
| Immigrants | Germany | 76.1 /100 | #152 | Good 60.3% |
| Sierra Leoneans | 74.1 /100 | #153 | Good 60.2% |
| Sudanese | 73.0 /100 | #154 | Good 60.2% |
| Moroccans | 72.9 /100 | #155 | Good 60.2% |
| Finns | 72.9 /100 | #156 | Good 60.2% |
| Immigrants | Armenia | 68.8 /100 | #157 | Good 60.0% |
| English | 67.2 /100 | #158 | Good 60.0% |
| Immigrants | Iraq | 67.0 /100 | #159 | Good 60.0% |
| South American Indians | 66.9 /100 | #160 | Good 60.0% |
| Somalis | 64.5 /100 | #161 | Good 59.9% |