Czechoslovakian vs Immigrants from Moldova Disability Age 65 to 74
COMPARE
Czechoslovakian
Immigrants from Moldova
Disability Age 65 to 74
Disability Age 65 to 74 Comparison
Czechoslovakians
Immigrants from Moldova
23.0%
DISABILITY AGE 65 TO 74
72.4/ 100
METRIC RATING
157th/ 347
METRIC RANK
22.7%
DISABILITY AGE 65 TO 74
87.3/ 100
METRIC RATING
138th/ 347
METRIC RANK
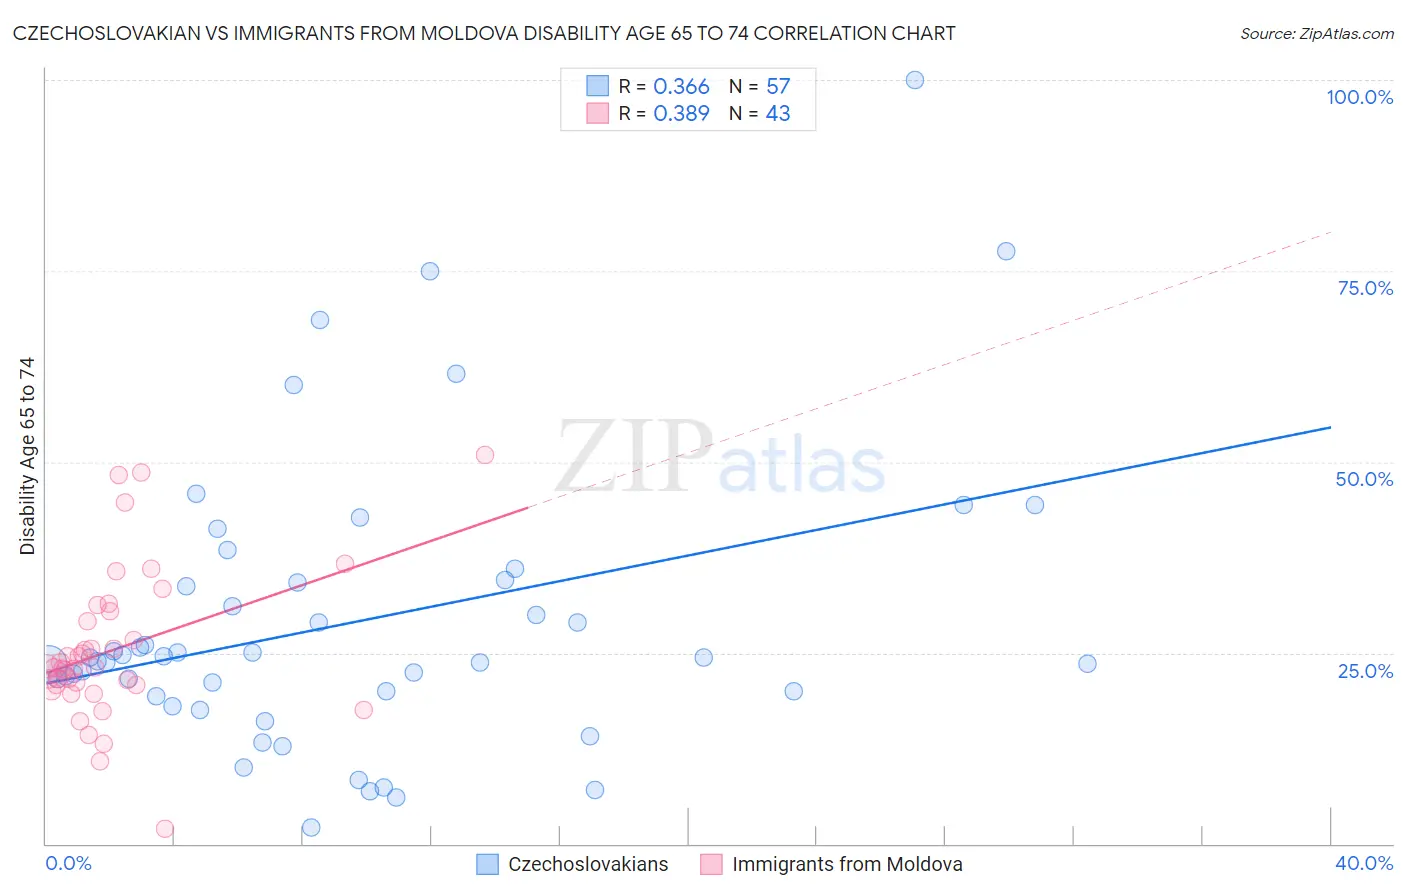
Czechoslovakian vs Immigrants from Moldova Disability Age 65 to 74 Correlation Chart
The statistical analysis conducted on geographies consisting of 368,238,154 people shows a mild positive correlation between the proportion of Czechoslovakians and percentage of population with a disability between the ages 65 and 75 in the United States with a correlation coefficient (R) of 0.366 and weighted average of 23.0%. Similarly, the statistical analysis conducted on geographies consisting of 124,298,636 people shows a mild positive correlation between the proportion of Immigrants from Moldova and percentage of population with a disability between the ages 65 and 75 in the United States with a correlation coefficient (R) of 0.389 and weighted average of 22.7%, a difference of 1.4%.
Disability Age 65 to 74 Correlation Summary
| Measurement | Czechoslovakian | Immigrants from Moldova |
| Minimum | 2.1% | 2.0% |
| Maximum | 100.0% | 50.9% |
| Range | 97.9% | 49.0% |
| Mean | 29.0% | 25.5% |
| Median | 24.3% | 23.1% |
| Interquartile 25% (IQ1) | 19.6% | 20.8% |
| Interquartile 75% (IQ3) | 34.3% | 30.4% |
| Interquartile Range (IQR) | 14.7% | 9.6% |
| Standard Deviation (Sample) | 18.9% | 9.9% |
| Standard Deviation (Population) | 18.7% | 9.8% |
Demographics Similar to Czechoslovakians and Immigrants from Moldova by Disability Age 65 to 74
In terms of disability age 65 to 74, the demographic groups most similar to Czechoslovakians are British (23.0%, a difference of 0.11%), Immigrants from Western Asia (23.0%, a difference of 0.11%), Sri Lankan (23.0%, a difference of 0.12%), Slavic (23.0%, a difference of 0.21%), and Finnish (22.9%, a difference of 0.32%). Similarly, the demographic groups most similar to Immigrants from Moldova are Taiwanese (22.7%, a difference of 0.050%), Immigrants from Syria (22.7%, a difference of 0.19%), Ugandan (22.7%, a difference of 0.23%), Belgian (22.7%, a difference of 0.24%), and Immigrants from Ethiopia (22.7%, a difference of 0.25%).
| Demographics | Rating | Rank | Disability Age 65 to 74 |
| Taiwanese | 87.6 /100 | #137 | Excellent 22.7% |
| Immigrants | Moldova | 87.3 /100 | #138 | Excellent 22.7% |
| Immigrants | Syria | 85.8 /100 | #139 | Excellent 22.7% |
| Ugandans | 85.4 /100 | #140 | Excellent 22.7% |
| Belgians | 85.3 /100 | #141 | Excellent 22.7% |
| Immigrants | Ethiopia | 85.3 /100 | #142 | Excellent 22.7% |
| Arabs | 84.8 /100 | #143 | Excellent 22.8% |
| Danes | 84.4 /100 | #144 | Excellent 22.8% |
| Immigrants | Uganda | 84.0 /100 | #145 | Excellent 22.8% |
| Alsatians | 83.7 /100 | #146 | Excellent 22.8% |
| Immigrants | Uzbekistan | 83.1 /100 | #147 | Excellent 22.8% |
| New Zealanders | 79.9 /100 | #148 | Good 22.9% |
| Swiss | 79.7 /100 | #149 | Good 22.9% |
| Canadians | 77.7 /100 | #150 | Good 22.9% |
| Immigrants | Morocco | 77.6 /100 | #151 | Good 22.9% |
| Finns | 76.5 /100 | #152 | Good 22.9% |
| Slavs | 75.2 /100 | #153 | Good 23.0% |
| Sri Lankans | 74.0 /100 | #154 | Good 23.0% |
| British | 73.9 /100 | #155 | Good 23.0% |
| Immigrants | Western Asia | 73.8 /100 | #156 | Good 23.0% |
| Czechoslovakians | 72.4 /100 | #157 | Good 23.0% |