Cypriot vs Macedonian Disability Age Over 75
COMPARE
Cypriot
Macedonian
Disability Age Over 75
Disability Age Over 75 Comparison
Cypriots
Macedonians
43.5%
DISABILITY AGE OVER 75
100.0/ 100
METRIC RATING
1st/ 347
METRIC RANK
45.4%
DISABILITY AGE OVER 75
99.9/ 100
METRIC RATING
26th/ 347
METRIC RANK
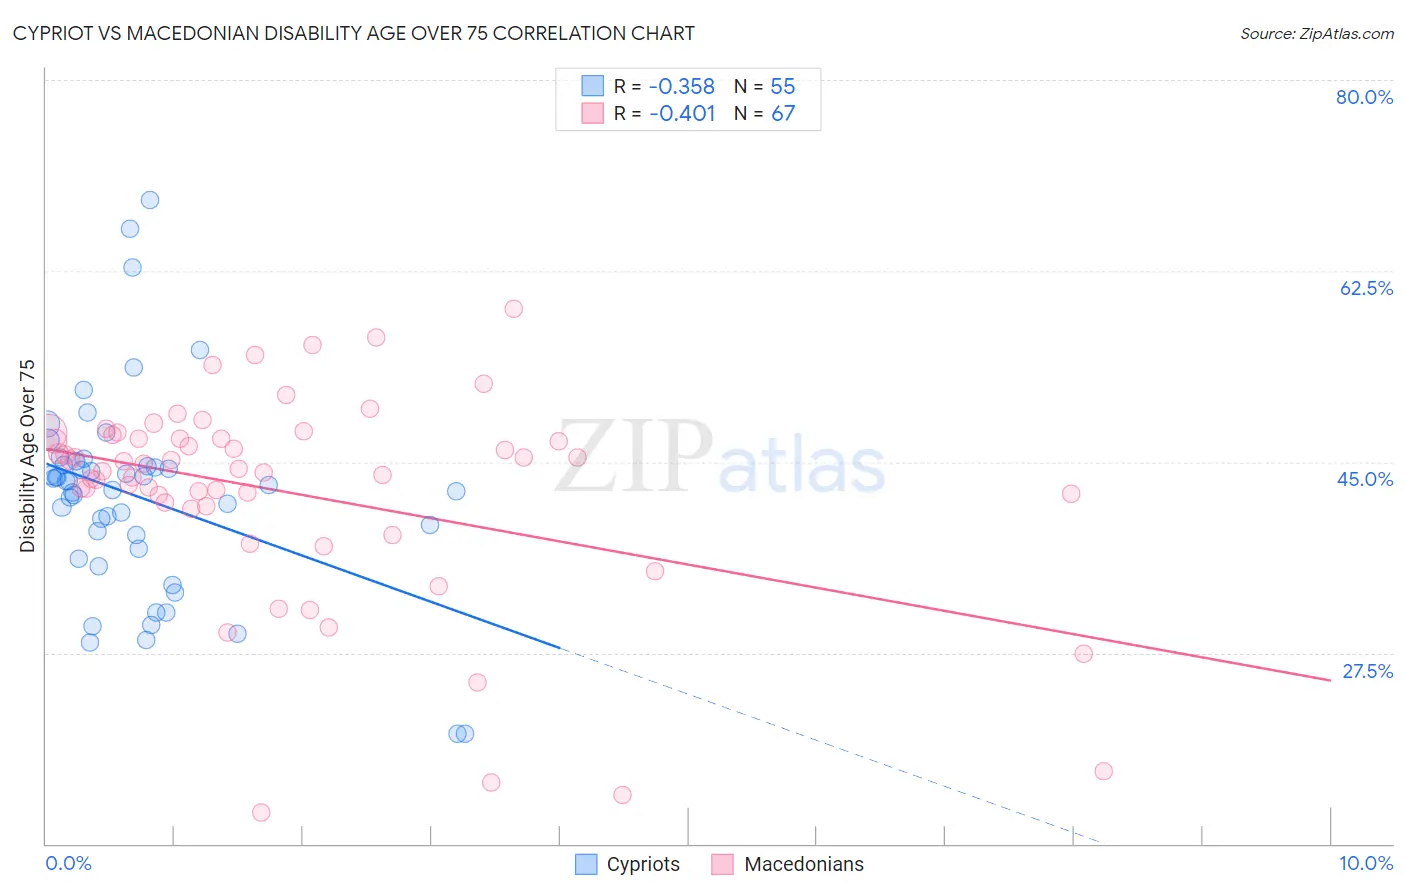
Cypriot vs Macedonian Disability Age Over 75 Correlation Chart
The statistical analysis conducted on geographies consisting of 61,837,952 people shows a mild negative correlation between the proportion of Cypriots and percentage of population with a disability over the age of 75 in the United States with a correlation coefficient (R) of -0.358 and weighted average of 43.5%. Similarly, the statistical analysis conducted on geographies consisting of 132,585,926 people shows a moderate negative correlation between the proportion of Macedonians and percentage of population with a disability over the age of 75 in the United States with a correlation coefficient (R) of -0.401 and weighted average of 45.4%, a difference of 4.3%.
Disability Age Over 75 Correlation Summary
| Measurement | Cypriot | Macedonian |
| Minimum | 20.1% | 12.8% |
| Maximum | 69.0% | 59.0% |
| Range | 48.9% | 46.2% |
| Mean | 41.8% | 42.2% |
| Median | 42.9% | 44.3% |
| Interquartile 25% (IQ1) | 37.0% | 40.9% |
| Interquartile 75% (IQ3) | 44.7% | 47.1% |
| Interquartile Range (IQR) | 7.7% | 6.2% |
| Standard Deviation (Sample) | 9.3% | 9.5% |
| Standard Deviation (Population) | 9.3% | 9.5% |
Similar Demographics by Disability Age Over 75
Demographics Similar to Cypriots by Disability Age Over 75
In terms of disability age over 75, the demographic groups most similar to Cypriots are Immigrants from Ireland (44.7%, a difference of 2.7%), Eastern European (44.8%, a difference of 3.0%), Carpatho Rusyn (44.8%, a difference of 3.0%), Luxembourger (44.8%, a difference of 3.0%), and Immigrants from Lithuania (44.9%, a difference of 3.1%).
| Demographics | Rating | Rank | Disability Age Over 75 |
| Cypriots | 100.0 /100 | #1 | Exceptional 43.5% |
| Immigrants | Ireland | 100.0 /100 | #2 | Exceptional 44.7% |
| Eastern Europeans | 100.0 /100 | #3 | Exceptional 44.8% |
| Carpatho Rusyns | 100.0 /100 | #4 | Exceptional 44.8% |
| Luxembourgers | 100.0 /100 | #5 | Exceptional 44.8% |
| Immigrants | Lithuania | 100.0 /100 | #6 | Exceptional 44.9% |
| Okinawans | 100.0 /100 | #7 | Exceptional 44.9% |
| Immigrants | Austria | 100.0 /100 | #8 | Exceptional 44.9% |
| Paraguayans | 100.0 /100 | #9 | Exceptional 45.0% |
| Bulgarians | 100.0 /100 | #10 | Exceptional 45.1% |
| Lithuanians | 100.0 /100 | #11 | Exceptional 45.1% |
| Immigrants | Czechoslovakia | 100.0 /100 | #12 | Exceptional 45.1% |
| Latvians | 100.0 /100 | #13 | Exceptional 45.1% |
| Immigrants | Scotland | 100.0 /100 | #14 | Exceptional 45.1% |
| Immigrants | Sweden | 100.0 /100 | #15 | Exceptional 45.1% |
Demographics Similar to Macedonians by Disability Age Over 75
In terms of disability age over 75, the demographic groups most similar to Macedonians are Immigrants from Poland (45.4%, a difference of 0.010%), Immigrants from Bolivia (45.4%, a difference of 0.040%), Thai (45.4%, a difference of 0.040%), Polish (45.3%, a difference of 0.080%), and Filipino (45.4%, a difference of 0.080%).
| Demographics | Rating | Rank | Disability Age Over 75 |
| Immigrants | Greece | 100.0 /100 | #19 | Exceptional 45.2% |
| Immigrants | Serbia | 100.0 /100 | #20 | Exceptional 45.3% |
| Immigrants | Belgium | 100.0 /100 | #21 | Exceptional 45.3% |
| Immigrants | South Africa | 100.0 /100 | #22 | Exceptional 45.3% |
| Immigrants | Switzerland | 99.9 /100 | #23 | Exceptional 45.3% |
| Poles | 99.9 /100 | #24 | Exceptional 45.3% |
| Immigrants | Bolivia | 99.9 /100 | #25 | Exceptional 45.4% |
| Macedonians | 99.9 /100 | #26 | Exceptional 45.4% |
| Immigrants | Poland | 99.9 /100 | #27 | Exceptional 45.4% |
| Thais | 99.9 /100 | #28 | Exceptional 45.4% |
| Filipinos | 99.9 /100 | #29 | Exceptional 45.4% |
| Immigrants | Denmark | 99.9 /100 | #30 | Exceptional 45.4% |
| Immigrants | Bulgaria | 99.9 /100 | #31 | Exceptional 45.5% |
| Immigrants | Australia | 99.9 /100 | #32 | Exceptional 45.5% |
| Immigrants | Croatia | 99.9 /100 | #33 | Exceptional 45.5% |