Immigrants from Southern Europe vs Macedonian Disability Age Over 75
COMPARE
Immigrants from Southern Europe
Macedonian
Disability Age Over 75
Disability Age Over 75 Comparison
Immigrants from Southern Europe
Macedonians
46.2%
DISABILITY AGE OVER 75
98.6/ 100
METRIC RATING
85th/ 347
METRIC RANK
45.4%
DISABILITY AGE OVER 75
99.9/ 100
METRIC RATING
26th/ 347
METRIC RANK
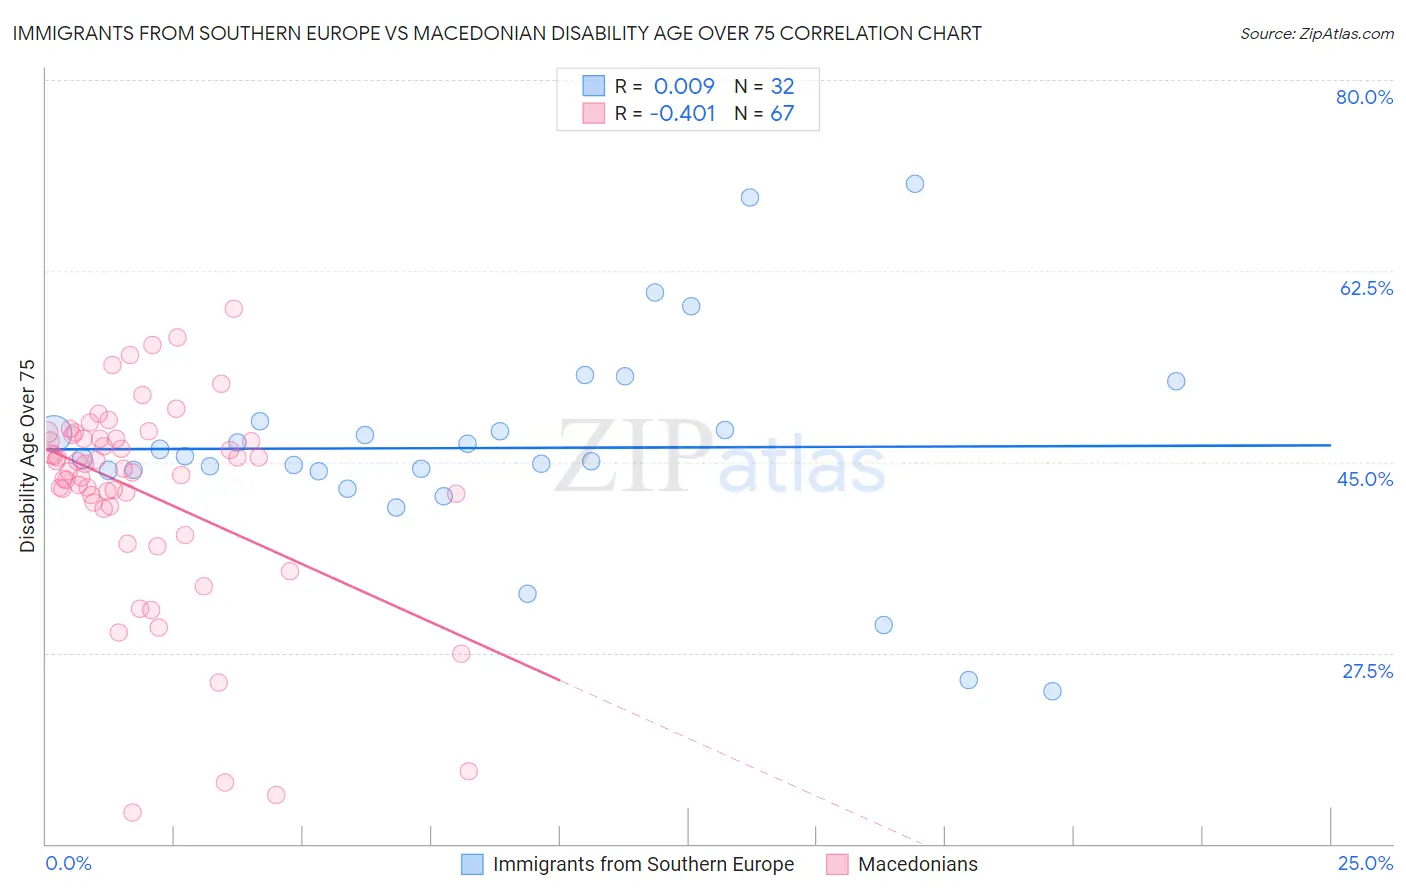
Immigrants from Southern Europe vs Macedonian Disability Age Over 75 Correlation Chart
The statistical analysis conducted on geographies consisting of 402,258,817 people shows no correlation between the proportion of Immigrants from Southern Europe and percentage of population with a disability over the age of 75 in the United States with a correlation coefficient (R) of 0.009 and weighted average of 46.2%. Similarly, the statistical analysis conducted on geographies consisting of 132,585,926 people shows a moderate negative correlation between the proportion of Macedonians and percentage of population with a disability over the age of 75 in the United States with a correlation coefficient (R) of -0.401 and weighted average of 45.4%, a difference of 1.8%.
Disability Age Over 75 Correlation Summary
| Measurement | Immigrants from Southern Europe | Macedonian |
| Minimum | 23.9% | 12.8% |
| Maximum | 70.5% | 59.0% |
| Range | 46.5% | 46.2% |
| Mean | 46.3% | 42.2% |
| Median | 45.4% | 44.3% |
| Interquartile 25% (IQ1) | 44.2% | 40.9% |
| Interquartile 75% (IQ3) | 48.3% | 47.1% |
| Interquartile Range (IQR) | 4.2% | 6.2% |
| Standard Deviation (Sample) | 10.0% | 9.5% |
| Standard Deviation (Population) | 9.9% | 9.5% |
Similar Demographics by Disability Age Over 75
Demographics Similar to Immigrants from Southern Europe by Disability Age Over 75
In terms of disability age over 75, the demographic groups most similar to Immigrants from Southern Europe are Romanian (46.2%, a difference of 0.0%), Danish (46.2%, a difference of 0.010%), Immigrants from Jordan (46.2%, a difference of 0.020%), Immigrants from Latvia (46.2%, a difference of 0.030%), and Argentinean (46.2%, a difference of 0.030%).
| Demographics | Rating | Rank | Disability Age Over 75 |
| Immigrants | Western Europe | 98.8 /100 | #78 | Exceptional 46.2% |
| Swiss | 98.8 /100 | #79 | Exceptional 46.2% |
| Soviet Union | 98.8 /100 | #80 | Exceptional 46.2% |
| New Zealanders | 98.8 /100 | #81 | Exceptional 46.2% |
| Immigrants | Latvia | 98.7 /100 | #82 | Exceptional 46.2% |
| Argentineans | 98.7 /100 | #83 | Exceptional 46.2% |
| Immigrants | Jordan | 98.7 /100 | #84 | Exceptional 46.2% |
| Immigrants | Southern Europe | 98.6 /100 | #85 | Exceptional 46.2% |
| Romanians | 98.6 /100 | #86 | Exceptional 46.2% |
| Danes | 98.6 /100 | #87 | Exceptional 46.2% |
| Uruguayans | 98.4 /100 | #88 | Exceptional 46.2% |
| Immigrants | Saudi Arabia | 98.4 /100 | #89 | Exceptional 46.3% |
| Northern Europeans | 98.3 /100 | #90 | Exceptional 46.3% |
| Immigrants | Egypt | 98.3 /100 | #91 | Exceptional 46.3% |
| Germans | 98.2 /100 | #92 | Exceptional 46.3% |
Demographics Similar to Macedonians by Disability Age Over 75
In terms of disability age over 75, the demographic groups most similar to Macedonians are Immigrants from Poland (45.4%, a difference of 0.010%), Immigrants from Bolivia (45.4%, a difference of 0.040%), Thai (45.4%, a difference of 0.040%), Polish (45.3%, a difference of 0.080%), and Filipino (45.4%, a difference of 0.080%).
| Demographics | Rating | Rank | Disability Age Over 75 |
| Immigrants | Greece | 100.0 /100 | #19 | Exceptional 45.2% |
| Immigrants | Serbia | 100.0 /100 | #20 | Exceptional 45.3% |
| Immigrants | Belgium | 100.0 /100 | #21 | Exceptional 45.3% |
| Immigrants | South Africa | 100.0 /100 | #22 | Exceptional 45.3% |
| Immigrants | Switzerland | 99.9 /100 | #23 | Exceptional 45.3% |
| Poles | 99.9 /100 | #24 | Exceptional 45.3% |
| Immigrants | Bolivia | 99.9 /100 | #25 | Exceptional 45.4% |
| Macedonians | 99.9 /100 | #26 | Exceptional 45.4% |
| Immigrants | Poland | 99.9 /100 | #27 | Exceptional 45.4% |
| Thais | 99.9 /100 | #28 | Exceptional 45.4% |
| Filipinos | 99.9 /100 | #29 | Exceptional 45.4% |
| Immigrants | Denmark | 99.9 /100 | #30 | Exceptional 45.4% |
| Immigrants | Bulgaria | 99.9 /100 | #31 | Exceptional 45.5% |
| Immigrants | Australia | 99.9 /100 | #32 | Exceptional 45.5% |
| Immigrants | Croatia | 99.9 /100 | #33 | Exceptional 45.5% |