Cypriot vs Immigrants from Nigeria Disability Age Over 75
COMPARE
Cypriot
Immigrants from Nigeria
Disability Age Over 75
Disability Age Over 75 Comparison
Cypriots
Immigrants from Nigeria
43.5%
DISABILITY AGE OVER 75
100.0/ 100
METRIC RATING
1st/ 347
METRIC RANK
47.5%
DISABILITY AGE OVER 75
34.0/ 100
METRIC RATING
184th/ 347
METRIC RANK
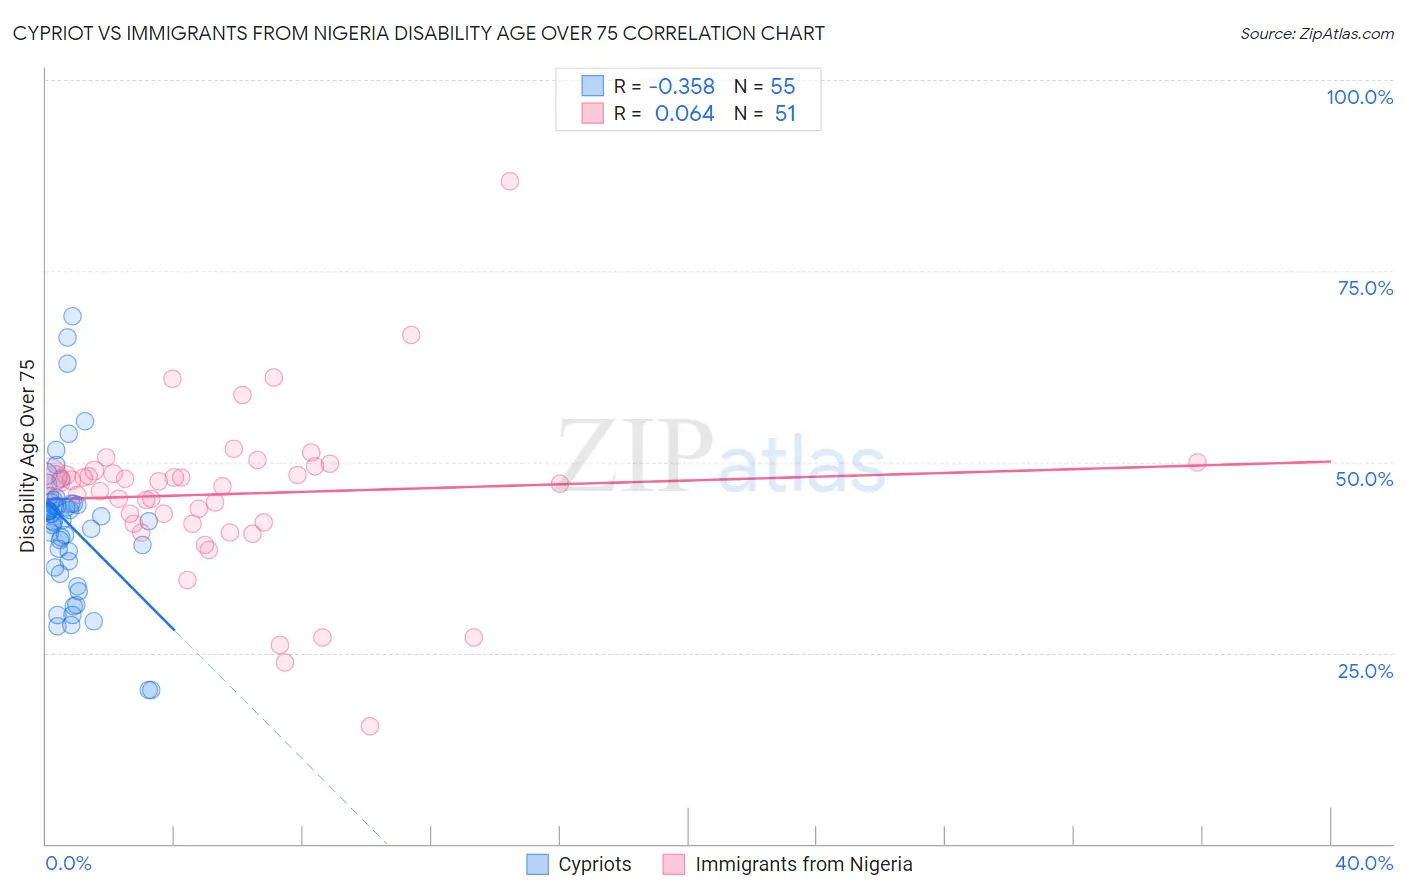
Cypriot vs Immigrants from Nigeria Disability Age Over 75 Correlation Chart
The statistical analysis conducted on geographies consisting of 61,837,952 people shows a mild negative correlation between the proportion of Cypriots and percentage of population with a disability over the age of 75 in the United States with a correlation coefficient (R) of -0.358 and weighted average of 43.5%. Similarly, the statistical analysis conducted on geographies consisting of 283,030,809 people shows a slight positive correlation between the proportion of Immigrants from Nigeria and percentage of population with a disability over the age of 75 in the United States with a correlation coefficient (R) of 0.064 and weighted average of 47.5%, a difference of 9.2%.
Disability Age Over 75 Correlation Summary
| Measurement | Cypriot | Immigrants from Nigeria |
| Minimum | 20.1% | 15.5% |
| Maximum | 69.0% | 86.8% |
| Range | 48.9% | 71.3% |
| Mean | 41.8% | 45.8% |
| Median | 42.9% | 47.5% |
| Interquartile 25% (IQ1) | 37.0% | 42.0% |
| Interquartile 75% (IQ3) | 44.7% | 48.9% |
| Interquartile Range (IQR) | 7.7% | 6.9% |
| Standard Deviation (Sample) | 9.3% | 10.8% |
| Standard Deviation (Population) | 9.3% | 10.7% |
Similar Demographics by Disability Age Over 75
Demographics Similar to Cypriots by Disability Age Over 75
In terms of disability age over 75, the demographic groups most similar to Cypriots are Immigrants from Ireland (44.7%, a difference of 2.7%), Eastern European (44.8%, a difference of 3.0%), Carpatho Rusyn (44.8%, a difference of 3.0%), Luxembourger (44.8%, a difference of 3.0%), and Immigrants from Lithuania (44.9%, a difference of 3.1%).
| Demographics | Rating | Rank | Disability Age Over 75 |
| Cypriots | 100.0 /100 | #1 | Exceptional 43.5% |
| Immigrants | Ireland | 100.0 /100 | #2 | Exceptional 44.7% |
| Eastern Europeans | 100.0 /100 | #3 | Exceptional 44.8% |
| Carpatho Rusyns | 100.0 /100 | #4 | Exceptional 44.8% |
| Luxembourgers | 100.0 /100 | #5 | Exceptional 44.8% |
| Immigrants | Lithuania | 100.0 /100 | #6 | Exceptional 44.9% |
| Okinawans | 100.0 /100 | #7 | Exceptional 44.9% |
| Immigrants | Austria | 100.0 /100 | #8 | Exceptional 44.9% |
| Paraguayans | 100.0 /100 | #9 | Exceptional 45.0% |
| Bulgarians | 100.0 /100 | #10 | Exceptional 45.1% |
| Lithuanians | 100.0 /100 | #11 | Exceptional 45.1% |
| Immigrants | Czechoslovakia | 100.0 /100 | #12 | Exceptional 45.1% |
| Latvians | 100.0 /100 | #13 | Exceptional 45.1% |
| Immigrants | Scotland | 100.0 /100 | #14 | Exceptional 45.1% |
| Immigrants | Sweden | 100.0 /100 | #15 | Exceptional 45.1% |
Demographics Similar to Immigrants from Nigeria by Disability Age Over 75
In terms of disability age over 75, the demographic groups most similar to Immigrants from Nigeria are Ghanaian (47.5%, a difference of 0.030%), Sudanese (47.5%, a difference of 0.050%), Immigrants from Sudan (47.5%, a difference of 0.060%), Basque (47.6%, a difference of 0.080%), and Immigrants from Kenya (47.6%, a difference of 0.080%).
| Demographics | Rating | Rank | Disability Age Over 75 |
| Haitians | 44.6 /100 | #177 | Average 47.4% |
| Cubans | 42.1 /100 | #178 | Average 47.4% |
| Sierra Leoneans | 41.7 /100 | #179 | Average 47.4% |
| Immigrants | Ecuador | 41.7 /100 | #180 | Average 47.4% |
| Immigrants | Kazakhstan | 40.4 /100 | #181 | Average 47.4% |
| Immigrants | Moldova | 39.9 /100 | #182 | Fair 47.4% |
| Delaware | 39.1 /100 | #183 | Fair 47.5% |
| Immigrants | Nigeria | 34.0 /100 | #184 | Fair 47.5% |
| Ghanaians | 33.0 /100 | #185 | Fair 47.5% |
| Sudanese | 32.0 /100 | #186 | Fair 47.5% |
| Immigrants | Sudan | 31.8 /100 | #187 | Fair 47.5% |
| Basques | 30.9 /100 | #188 | Fair 47.6% |
| Immigrants | Kenya | 30.8 /100 | #189 | Fair 47.6% |
| Somalis | 29.5 /100 | #190 | Fair 47.6% |
| Portuguese | 29.3 /100 | #191 | Fair 47.6% |