Cypriot vs Ute Disability Age Over 75
COMPARE
Cypriot
Ute
Disability Age Over 75
Disability Age Over 75 Comparison
Cypriots
Ute
43.5%
DISABILITY AGE OVER 75
100.0/ 100
METRIC RATING
1st/ 347
METRIC RANK
52.6%
DISABILITY AGE OVER 75
0.0/ 100
METRIC RATING
326th/ 347
METRIC RANK
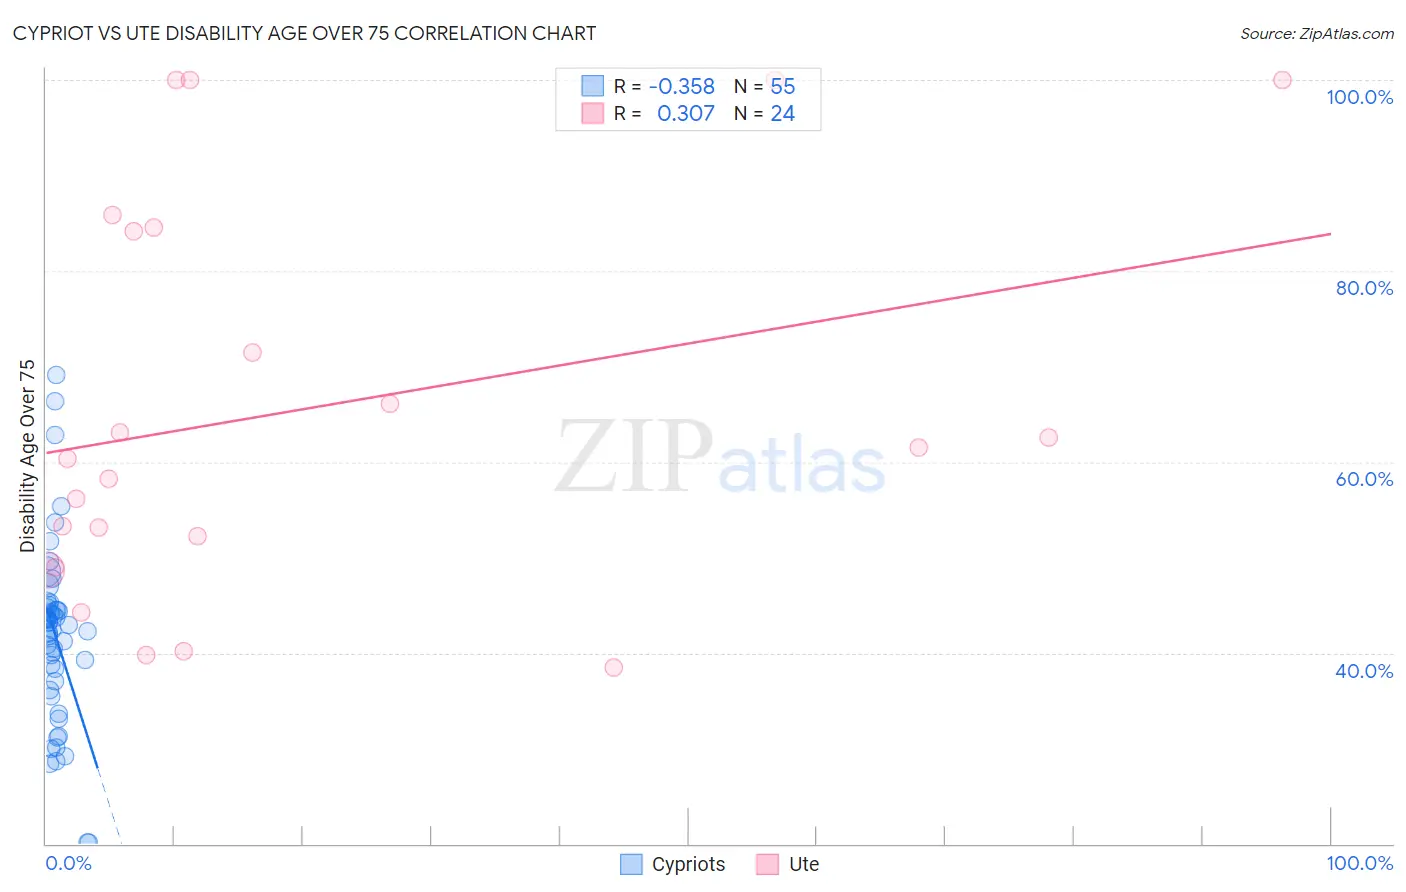
Cypriot vs Ute Disability Age Over 75 Correlation Chart
The statistical analysis conducted on geographies consisting of 61,837,952 people shows a mild negative correlation between the proportion of Cypriots and percentage of population with a disability over the age of 75 in the United States with a correlation coefficient (R) of -0.358 and weighted average of 43.5%. Similarly, the statistical analysis conducted on geographies consisting of 55,664,010 people shows a mild positive correlation between the proportion of Ute and percentage of population with a disability over the age of 75 in the United States with a correlation coefficient (R) of 0.307 and weighted average of 52.6%, a difference of 20.8%.
Disability Age Over 75 Correlation Summary
| Measurement | Cypriot | Ute |
| Minimum | 20.1% | 38.5% |
| Maximum | 69.0% | 100.0% |
| Range | 48.9% | 61.5% |
| Mean | 41.8% | 65.5% |
| Median | 42.9% | 60.9% |
| Interquartile 25% (IQ1) | 37.0% | 50.6% |
| Interquartile 75% (IQ3) | 44.7% | 84.4% |
| Interquartile Range (IQR) | 7.7% | 33.9% |
| Standard Deviation (Sample) | 9.3% | 20.5% |
| Standard Deviation (Population) | 9.3% | 20.1% |
Similar Demographics by Disability Age Over 75
Demographics Similar to Cypriots by Disability Age Over 75
In terms of disability age over 75, the demographic groups most similar to Cypriots are Immigrants from Ireland (44.7%, a difference of 2.7%), Eastern European (44.8%, a difference of 3.0%), Carpatho Rusyn (44.8%, a difference of 3.0%), Luxembourger (44.8%, a difference of 3.0%), and Immigrants from Lithuania (44.9%, a difference of 3.1%).
| Demographics | Rating | Rank | Disability Age Over 75 |
| Cypriots | 100.0 /100 | #1 | Exceptional 43.5% |
| Immigrants | Ireland | 100.0 /100 | #2 | Exceptional 44.7% |
| Eastern Europeans | 100.0 /100 | #3 | Exceptional 44.8% |
| Carpatho Rusyns | 100.0 /100 | #4 | Exceptional 44.8% |
| Luxembourgers | 100.0 /100 | #5 | Exceptional 44.8% |
| Immigrants | Lithuania | 100.0 /100 | #6 | Exceptional 44.9% |
| Okinawans | 100.0 /100 | #7 | Exceptional 44.9% |
| Immigrants | Austria | 100.0 /100 | #8 | Exceptional 44.9% |
| Paraguayans | 100.0 /100 | #9 | Exceptional 45.0% |
| Bulgarians | 100.0 /100 | #10 | Exceptional 45.1% |
| Lithuanians | 100.0 /100 | #11 | Exceptional 45.1% |
| Immigrants | Czechoslovakia | 100.0 /100 | #12 | Exceptional 45.1% |
| Latvians | 100.0 /100 | #13 | Exceptional 45.1% |
| Immigrants | Scotland | 100.0 /100 | #14 | Exceptional 45.1% |
| Immigrants | Sweden | 100.0 /100 | #15 | Exceptional 45.1% |
Demographics Similar to Ute by Disability Age Over 75
In terms of disability age over 75, the demographic groups most similar to Ute are Nepalese (52.6%, a difference of 0.030%), Choctaw (52.7%, a difference of 0.22%), Immigrants from Cabo Verde (52.4%, a difference of 0.35%), Alaska Native (52.8%, a difference of 0.44%), and Menominee (52.3%, a difference of 0.51%).
| Demographics | Rating | Rank | Disability Age Over 75 |
| Creek | 0.0 /100 | #319 | Tragic 51.5% |
| Paiute | 0.0 /100 | #320 | Tragic 51.5% |
| Dutch West Indians | 0.0 /100 | #321 | Tragic 51.5% |
| Comanche | 0.0 /100 | #322 | Tragic 51.7% |
| Immigrants | Yemen | 0.0 /100 | #323 | Tragic 52.0% |
| Menominee | 0.0 /100 | #324 | Tragic 52.3% |
| Immigrants | Cabo Verde | 0.0 /100 | #325 | Tragic 52.4% |
| Ute | 0.0 /100 | #326 | Tragic 52.6% |
| Nepalese | 0.0 /100 | #327 | Tragic 52.6% |
| Choctaw | 0.0 /100 | #328 | Tragic 52.7% |
| Alaska Natives | 0.0 /100 | #329 | Tragic 52.8% |
| Puerto Ricans | 0.0 /100 | #330 | Tragic 52.9% |
| Hopi | 0.0 /100 | #331 | Tragic 52.9% |
| Natives/Alaskans | 0.0 /100 | #332 | Tragic 53.1% |
| Apache | 0.0 /100 | #333 | Tragic 53.6% |