Cypriot vs Immigrants from Sudan Disability Age Under 5
COMPARE
Cypriot
Immigrants from Sudan
Disability Age Under 5
Disability Age Under 5 Comparison
Cypriots
Immigrants from Sudan
1.3%
DISABILITY AGE UNDER 5
14.9/ 100
METRIC RATING
217th/ 347
METRIC RANK
1.3%
DISABILITY AGE UNDER 5
18.7/ 100
METRIC RATING
213th/ 347
METRIC RANK
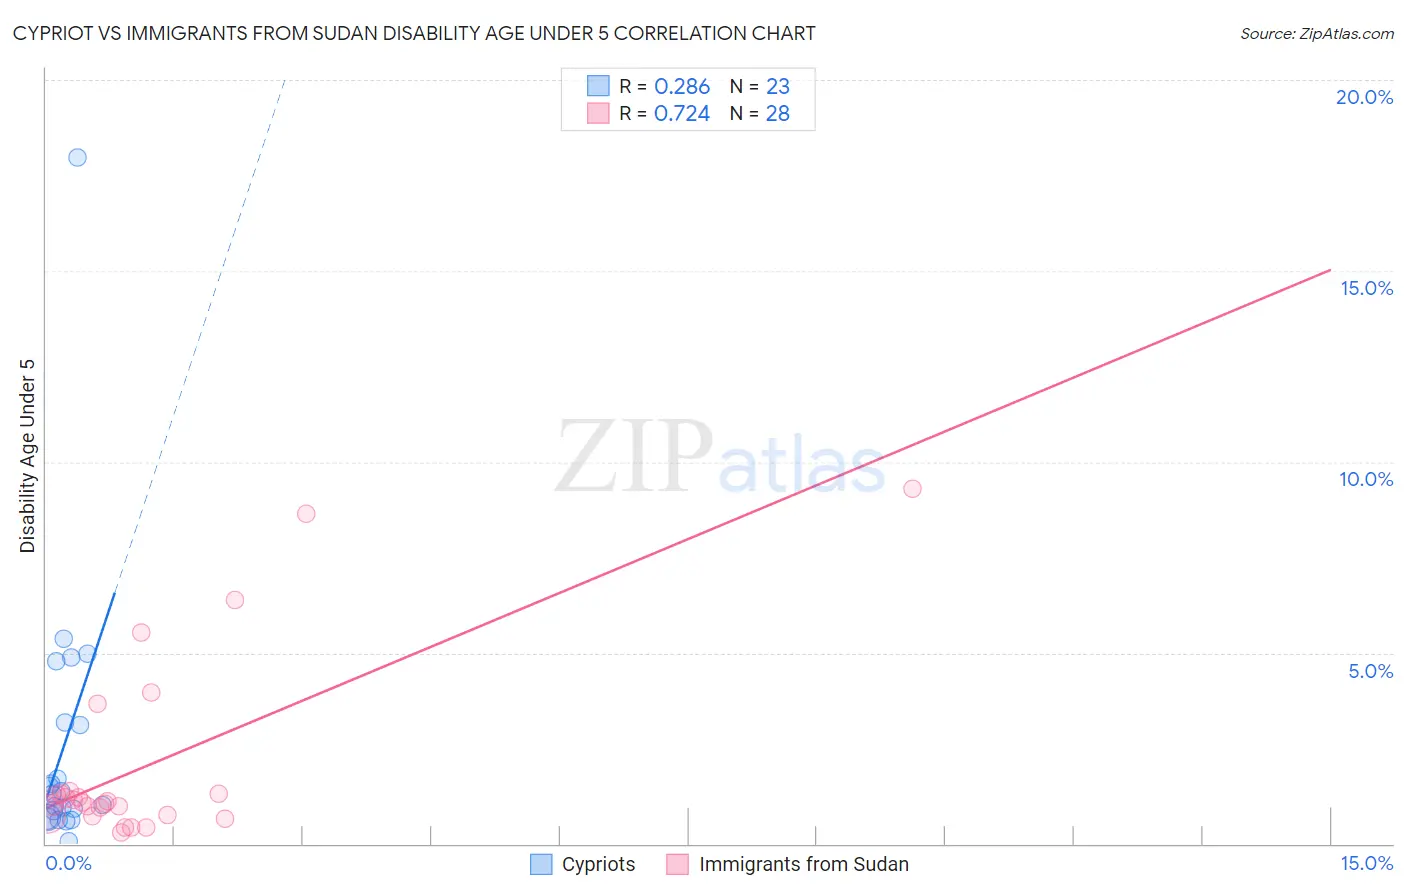
Cypriot vs Immigrants from Sudan Disability Age Under 5 Correlation Chart
The statistical analysis conducted on geographies consisting of 48,448,194 people shows a weak positive correlation between the proportion of Cypriots and percentage of population with a disability under the age of 5 in the United States with a correlation coefficient (R) of 0.286 and weighted average of 1.3%. Similarly, the statistical analysis conducted on geographies consisting of 92,125,670 people shows a strong positive correlation between the proportion of Immigrants from Sudan and percentage of population with a disability under the age of 5 in the United States with a correlation coefficient (R) of 0.724 and weighted average of 1.3%, a difference of 0.60%.
Disability Age Under 5 Correlation Summary
| Measurement | Cypriot | Immigrants from Sudan |
| Minimum | 0.058% | 0.29% |
| Maximum | 18.0% | 9.3% |
| Range | 17.9% | 9.0% |
| Mean | 2.6% | 2.1% |
| Median | 1.3% | 1.1% |
| Interquartile 25% (IQ1) | 0.68% | 0.74% |
| Interquartile 75% (IQ3) | 3.2% | 1.3% |
| Interquartile Range (IQR) | 2.5% | 0.60% |
| Standard Deviation (Sample) | 3.7% | 2.5% |
| Standard Deviation (Population) | 3.6% | 2.4% |
Demographics Similar to Cypriots and Immigrants from Sudan by Disability Age Under 5
In terms of disability age under 5, the demographic groups most similar to Cypriots are Bangladeshi (1.3%, a difference of 0.10%), Syrian (1.3%, a difference of 0.20%), Malaysian (1.3%, a difference of 0.31%), Immigrants from Chile (1.3%, a difference of 0.37%), and Chilean (1.3%, a difference of 0.61%). Similarly, the demographic groups most similar to Immigrants from Sudan are Chilean (1.3%, a difference of 0.010%), Immigrants from Greece (1.3%, a difference of 0.060%), Pakistani (1.3%, a difference of 0.10%), Bulgarian (1.3%, a difference of 0.11%), and Immigrants from Chile (1.3%, a difference of 0.23%).
| Demographics | Rating | Rank | Disability Age Under 5 |
| Romanians | 22.5 /100 | #205 | Fair 1.3% |
| Immigrants | Poland | 22.4 /100 | #206 | Fair 1.3% |
| Nigerians | 21.2 /100 | #207 | Fair 1.3% |
| Mexicans | 20.8 /100 | #208 | Fair 1.3% |
| Bulgarians | 19.5 /100 | #209 | Poor 1.3% |
| Pakistanis | 19.4 /100 | #210 | Poor 1.3% |
| Immigrants | Greece | 19.1 /100 | #211 | Poor 1.3% |
| Chileans | 18.8 /100 | #212 | Poor 1.3% |
| Immigrants | Sudan | 18.7 /100 | #213 | Poor 1.3% |
| Immigrants | Chile | 17.2 /100 | #214 | Poor 1.3% |
| Syrians | 16.1 /100 | #215 | Poor 1.3% |
| Bangladeshis | 15.5 /100 | #216 | Poor 1.3% |
| Cypriots | 14.9 /100 | #217 | Poor 1.3% |
| Malaysians | 13.2 /100 | #218 | Poor 1.3% |
| Immigrants | Croatia | 11.2 /100 | #219 | Poor 1.3% |
| Serbians | 9.6 /100 | #220 | Tragic 1.3% |
| Sub-Saharan Africans | 8.3 /100 | #221 | Tragic 1.3% |
| Ukrainians | 8.3 /100 | #222 | Tragic 1.3% |
| Hispanics or Latinos | 7.7 /100 | #223 | Tragic 1.3% |
| Latvians | 7.1 /100 | #224 | Tragic 1.3% |
| Panamanians | 7.1 /100 | #225 | Tragic 1.3% |