Immigrants from Scotland vs Immigrants from Sudan Disability Age Under 5
COMPARE
Immigrants from Scotland
Immigrants from Sudan
Disability Age Under 5
Disability Age Under 5 Comparison
Immigrants from Scotland
Immigrants from Sudan
1.4%
DISABILITY AGE UNDER 5
0.9/ 100
METRIC RATING
252nd/ 347
METRIC RANK
1.3%
DISABILITY AGE UNDER 5
18.7/ 100
METRIC RATING
213th/ 347
METRIC RANK
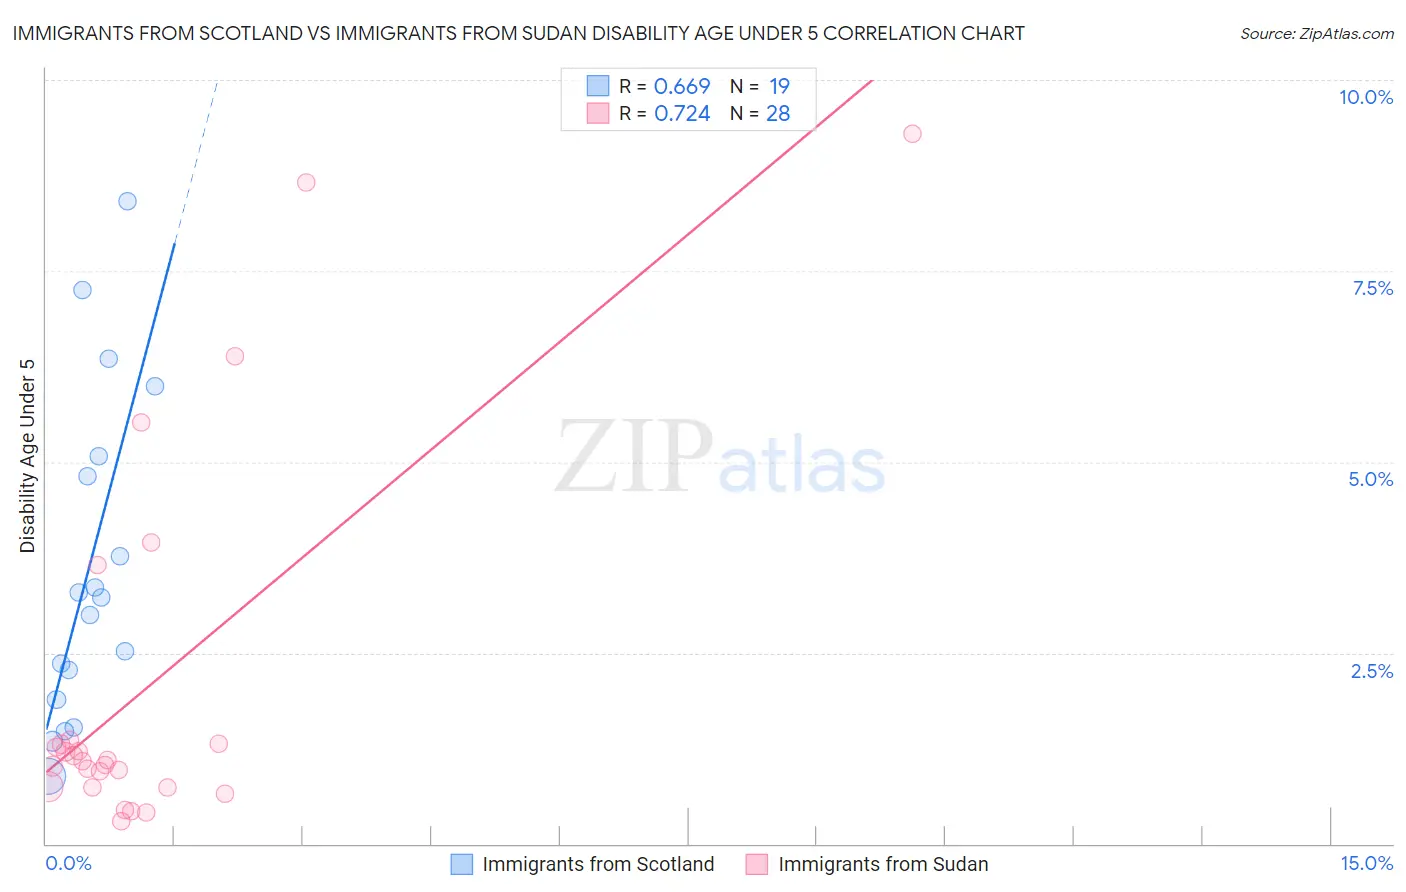
Immigrants from Scotland vs Immigrants from Sudan Disability Age Under 5 Correlation Chart
The statistical analysis conducted on geographies consisting of 125,019,989 people shows a significant positive correlation between the proportion of Immigrants from Scotland and percentage of population with a disability under the age of 5 in the United States with a correlation coefficient (R) of 0.669 and weighted average of 1.4%. Similarly, the statistical analysis conducted on geographies consisting of 92,125,670 people shows a strong positive correlation between the proportion of Immigrants from Sudan and percentage of population with a disability under the age of 5 in the United States with a correlation coefficient (R) of 0.724 and weighted average of 1.3%, a difference of 7.0%.
Disability Age Under 5 Correlation Summary
| Measurement | Immigrants from Scotland | Immigrants from Sudan |
| Minimum | 0.88% | 0.29% |
| Maximum | 8.4% | 9.3% |
| Range | 7.5% | 9.0% |
| Mean | 3.6% | 2.1% |
| Median | 3.2% | 1.1% |
| Interquartile 25% (IQ1) | 1.9% | 0.74% |
| Interquartile 75% (IQ3) | 5.1% | 1.3% |
| Interquartile Range (IQR) | 3.2% | 0.60% |
| Standard Deviation (Sample) | 2.1% | 2.5% |
| Standard Deviation (Population) | 2.1% | 2.4% |
Similar Demographics by Disability Age Under 5
Demographics Similar to Immigrants from Scotland by Disability Age Under 5
In terms of disability age under 5, the demographic groups most similar to Immigrants from Scotland are Immigrants from Hungary (1.4%, a difference of 0.040%), African (1.4%, a difference of 0.070%), Bermudan (1.4%, a difference of 0.080%), Eastern European (1.4%, a difference of 0.16%), and Immigrants from England (1.4%, a difference of 0.19%).
| Demographics | Rating | Rank | Disability Age Under 5 |
| Potawatomi | 1.1 /100 | #245 | Tragic 1.4% |
| Russians | 1.0 /100 | #246 | Tragic 1.4% |
| Immigrants | England | 1.0 /100 | #247 | Tragic 1.4% |
| Eastern Europeans | 1.0 /100 | #248 | Tragic 1.4% |
| Bermudans | 1.0 /100 | #249 | Tragic 1.4% |
| Africans | 1.0 /100 | #250 | Tragic 1.4% |
| Immigrants | Hungary | 1.0 /100 | #251 | Tragic 1.4% |
| Immigrants | Scotland | 0.9 /100 | #252 | Tragic 1.4% |
| Australians | 0.7 /100 | #253 | Tragic 1.4% |
| Immigrants | Brazil | 0.7 /100 | #254 | Tragic 1.4% |
| Immigrants | Liberia | 0.6 /100 | #255 | Tragic 1.4% |
| Immigrants | Western Europe | 0.5 /100 | #256 | Tragic 1.4% |
| Slovenes | 0.3 /100 | #257 | Tragic 1.4% |
| Costa Ricans | 0.3 /100 | #258 | Tragic 1.4% |
| Immigrants | Southern Europe | 0.3 /100 | #259 | Tragic 1.4% |
Demographics Similar to Immigrants from Sudan by Disability Age Under 5
In terms of disability age under 5, the demographic groups most similar to Immigrants from Sudan are Chilean (1.3%, a difference of 0.010%), Immigrants from Greece (1.3%, a difference of 0.060%), Pakistani (1.3%, a difference of 0.10%), Bulgarian (1.3%, a difference of 0.11%), and Immigrants from Chile (1.3%, a difference of 0.23%).
| Demographics | Rating | Rank | Disability Age Under 5 |
| Immigrants | Poland | 22.4 /100 | #206 | Fair 1.3% |
| Nigerians | 21.2 /100 | #207 | Fair 1.3% |
| Mexicans | 20.8 /100 | #208 | Fair 1.3% |
| Bulgarians | 19.5 /100 | #209 | Poor 1.3% |
| Pakistanis | 19.4 /100 | #210 | Poor 1.3% |
| Immigrants | Greece | 19.1 /100 | #211 | Poor 1.3% |
| Chileans | 18.8 /100 | #212 | Poor 1.3% |
| Immigrants | Sudan | 18.7 /100 | #213 | Poor 1.3% |
| Immigrants | Chile | 17.2 /100 | #214 | Poor 1.3% |
| Syrians | 16.1 /100 | #215 | Poor 1.3% |
| Bangladeshis | 15.5 /100 | #216 | Poor 1.3% |
| Cypriots | 14.9 /100 | #217 | Poor 1.3% |
| Malaysians | 13.2 /100 | #218 | Poor 1.3% |
| Immigrants | Croatia | 11.2 /100 | #219 | Poor 1.3% |
| Serbians | 9.6 /100 | #220 | Tragic 1.3% |