Colville vs Immigrants from Sudan Disability Age Under 5
COMPARE
Colville
Immigrants from Sudan
Disability Age Under 5
Disability Age Under 5 Comparison
Colville
Immigrants from Sudan
3.3%
DISABILITY AGE UNDER 5
0.0/ 100
METRIC RATING
343rd/ 347
METRIC RANK
1.3%
DISABILITY AGE UNDER 5
18.7/ 100
METRIC RATING
213th/ 347
METRIC RANK
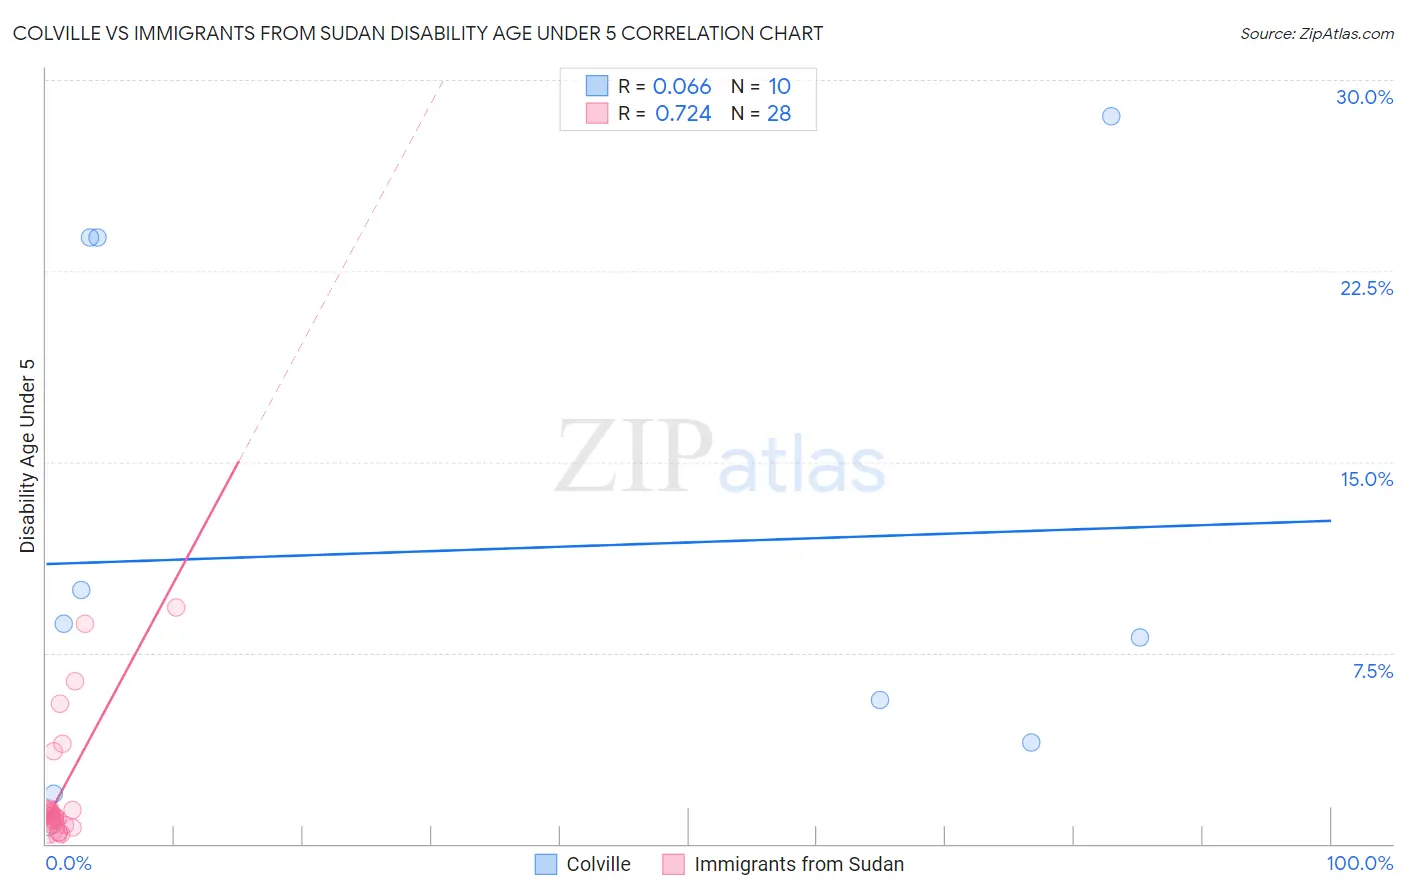
Colville vs Immigrants from Sudan Disability Age Under 5 Correlation Chart
The statistical analysis conducted on geographies consisting of 29,840,088 people shows a slight positive correlation between the proportion of Colville and percentage of population with a disability under the age of 5 in the United States with a correlation coefficient (R) of 0.066 and weighted average of 3.3%. Similarly, the statistical analysis conducted on geographies consisting of 92,125,670 people shows a strong positive correlation between the proportion of Immigrants from Sudan and percentage of population with a disability under the age of 5 in the United States with a correlation coefficient (R) of 0.724 and weighted average of 1.3%, a difference of 156.3%.
Disability Age Under 5 Correlation Summary
| Measurement | Colville | Immigrants from Sudan |
| Minimum | 0.81% | 0.29% |
| Maximum | 28.6% | 9.3% |
| Range | 27.8% | 9.0% |
| Mean | 11.5% | 2.1% |
| Median | 8.4% | 1.1% |
| Interquartile 25% (IQ1) | 4.0% | 0.74% |
| Interquartile 75% (IQ3) | 23.8% | 1.3% |
| Interquartile Range (IQR) | 19.8% | 0.60% |
| Standard Deviation (Sample) | 10.1% | 2.5% |
| Standard Deviation (Population) | 9.6% | 2.4% |
Similar Demographics by Disability Age Under 5
Demographics Similar to Colville by Disability Age Under 5
In terms of disability age under 5, the demographic groups most similar to Colville are Alaska Native (2.9%, a difference of 11.6%), Inupiat (3.7%, a difference of 13.0%), Paiute (3.9%, a difference of 19.0%), Tsimshian (2.4%, a difference of 36.3%), and Yup'ik (4.5%, a difference of 37.8%).
| Demographics | Rating | Rank | Disability Age Under 5 |
| Dutch West Indians | 0.0 /100 | #333 | Tragic 1.9% |
| Natives/Alaskans | 0.0 /100 | #334 | Tragic 1.9% |
| Pennsylvania Germans | 0.0 /100 | #335 | Tragic 1.9% |
| Paraguayans | 0.0 /100 | #336 | Tragic 2.0% |
| Apache | 0.0 /100 | #337 | Tragic 2.0% |
| Tohono O'odham | 0.0 /100 | #338 | Tragic 2.2% |
| Immigrants | Azores | 0.0 /100 | #339 | Tragic 2.2% |
| Menominee | 0.0 /100 | #340 | Tragic 2.3% |
| Tsimshian | 0.0 /100 | #341 | Tragic 2.4% |
| Alaska Natives | 0.0 /100 | #342 | Tragic 2.9% |
| Colville | 0.0 /100 | #343 | Tragic 3.3% |
| Inupiat | 0.0 /100 | #344 | Tragic 3.7% |
| Paiute | 0.0 /100 | #345 | Tragic 3.9% |
| Yup'ik | 0.0 /100 | #346 | Tragic 4.5% |
| Hopi | 0.0 /100 | #347 | Tragic 4.6% |
Demographics Similar to Immigrants from Sudan by Disability Age Under 5
In terms of disability age under 5, the demographic groups most similar to Immigrants from Sudan are Chilean (1.3%, a difference of 0.010%), Immigrants from Greece (1.3%, a difference of 0.060%), Pakistani (1.3%, a difference of 0.10%), Bulgarian (1.3%, a difference of 0.11%), and Immigrants from Chile (1.3%, a difference of 0.23%).
| Demographics | Rating | Rank | Disability Age Under 5 |
| Immigrants | Poland | 22.4 /100 | #206 | Fair 1.3% |
| Nigerians | 21.2 /100 | #207 | Fair 1.3% |
| Mexicans | 20.8 /100 | #208 | Fair 1.3% |
| Bulgarians | 19.5 /100 | #209 | Poor 1.3% |
| Pakistanis | 19.4 /100 | #210 | Poor 1.3% |
| Immigrants | Greece | 19.1 /100 | #211 | Poor 1.3% |
| Chileans | 18.8 /100 | #212 | Poor 1.3% |
| Immigrants | Sudan | 18.7 /100 | #213 | Poor 1.3% |
| Immigrants | Chile | 17.2 /100 | #214 | Poor 1.3% |
| Syrians | 16.1 /100 | #215 | Poor 1.3% |
| Bangladeshis | 15.5 /100 | #216 | Poor 1.3% |
| Cypriots | 14.9 /100 | #217 | Poor 1.3% |
| Malaysians | 13.2 /100 | #218 | Poor 1.3% |
| Immigrants | Croatia | 11.2 /100 | #219 | Poor 1.3% |
| Serbians | 9.6 /100 | #220 | Tragic 1.3% |