Yaqui vs Immigrants from Australia Disability Age 35 to 64
COMPARE
Yaqui
Immigrants from Australia
Disability Age 35 to 64
Disability Age 35 to 64 Comparison
Yaqui
Immigrants from Australia
13.5%
DISABILITY AGE 35 TO 64
0.0/ 100
METRIC RATING
294th/ 347
METRIC RANK
9.7%
DISABILITY AGE 35 TO 64
99.9/ 100
METRIC RATING
34th/ 347
METRIC RANK
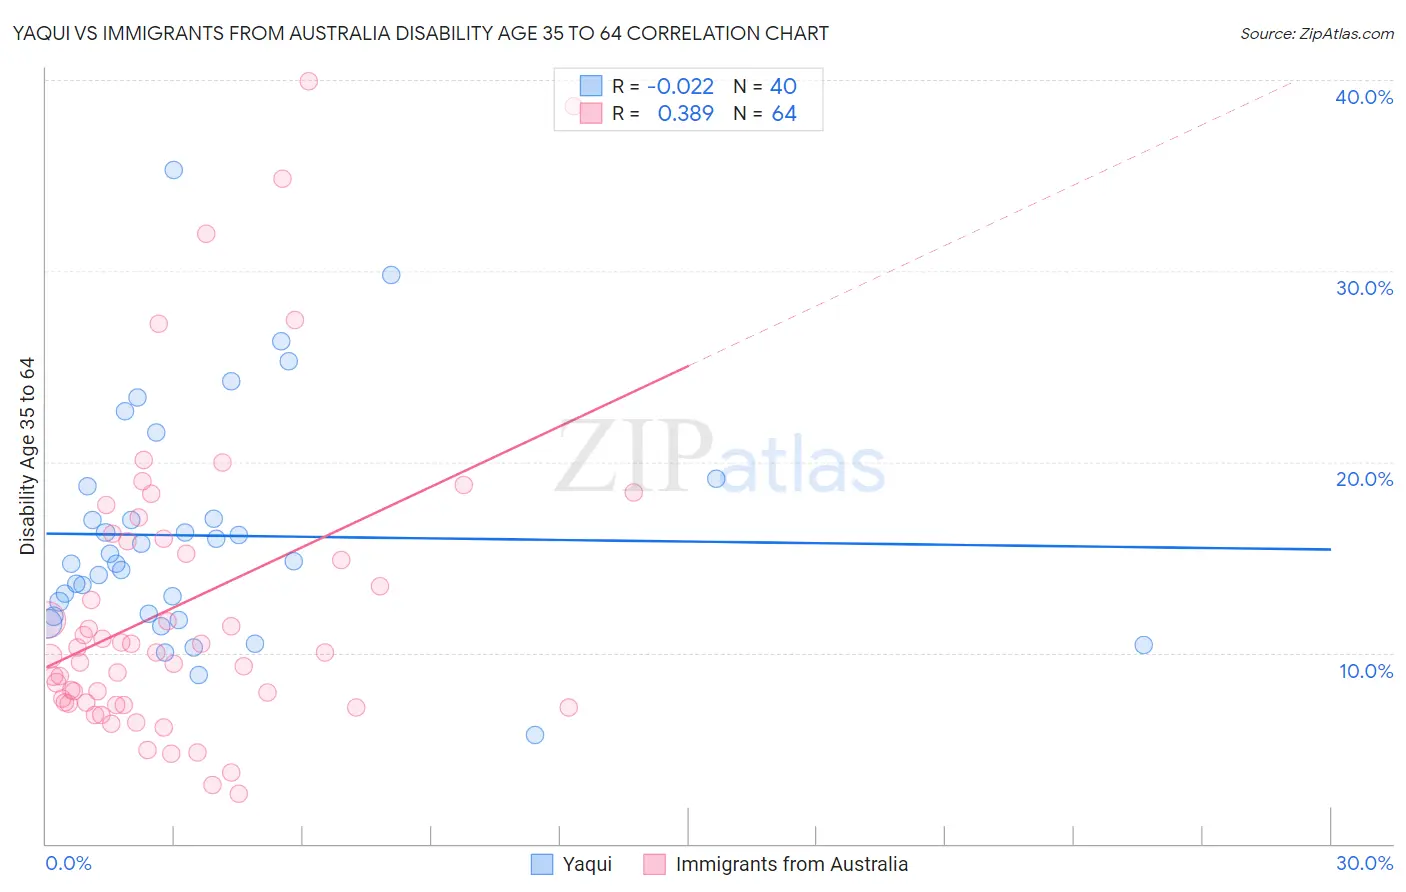
Yaqui vs Immigrants from Australia Disability Age 35 to 64 Correlation Chart
The statistical analysis conducted on geographies consisting of 107,720,635 people shows no correlation between the proportion of Yaqui and percentage of population with a disability between the ages 34 and 64 in the United States with a correlation coefficient (R) of -0.022 and weighted average of 13.5%. Similarly, the statistical analysis conducted on geographies consisting of 227,131,013 people shows a mild positive correlation between the proportion of Immigrants from Australia and percentage of population with a disability between the ages 34 and 64 in the United States with a correlation coefficient (R) of 0.389 and weighted average of 9.7%, a difference of 39.3%.
Disability Age 35 to 64 Correlation Summary
| Measurement | Yaqui | Immigrants from Australia |
| Minimum | 5.7% | 2.6% |
| Maximum | 35.3% | 40.0% |
| Range | 29.6% | 37.3% |
| Mean | 16.1% | 12.5% |
| Median | 14.8% | 10.0% |
| Interquartile 25% (IQ1) | 12.0% | 7.3% |
| Interquartile 75% (IQ3) | 17.9% | 15.9% |
| Interquartile Range (IQR) | 5.9% | 8.6% |
| Standard Deviation (Sample) | 6.0% | 8.1% |
| Standard Deviation (Population) | 5.9% | 8.1% |
Similar Demographics by Disability Age 35 to 64
Demographics Similar to Yaqui by Disability Age 35 to 64
In terms of disability age 35 to 64, the demographic groups most similar to Yaqui are Ute (13.4%, a difference of 0.58%), Yakama (13.6%, a difference of 0.68%), African (13.6%, a difference of 0.90%), Puget Sound Salish (13.3%, a difference of 1.1%), and Immigrants from Congo (13.3%, a difference of 1.1%).
| Demographics | Rating | Rank | Disability Age 35 to 64 |
| Tlingit-Haida | 0.0 /100 | #287 | Tragic 13.2% |
| Fijians | 0.0 /100 | #288 | Tragic 13.2% |
| Indonesians | 0.0 /100 | #289 | Tragic 13.2% |
| Immigrants | Liberia | 0.0 /100 | #290 | Tragic 13.2% |
| Immigrants | Congo | 0.0 /100 | #291 | Tragic 13.3% |
| Puget Sound Salish | 0.0 /100 | #292 | Tragic 13.3% |
| Ute | 0.0 /100 | #293 | Tragic 13.4% |
| Yaqui | 0.0 /100 | #294 | Tragic 13.5% |
| Yakama | 0.0 /100 | #295 | Tragic 13.6% |
| Africans | 0.0 /100 | #296 | Tragic 13.6% |
| Bangladeshis | 0.0 /100 | #297 | Tragic 13.6% |
| Cheyenne | 0.0 /100 | #298 | Tragic 13.6% |
| Spanish Americans | 0.0 /100 | #299 | Tragic 13.7% |
| Delaware | 0.0 /100 | #300 | Tragic 13.7% |
| French American Indians | 0.0 /100 | #301 | Tragic 13.7% |
Demographics Similar to Immigrants from Australia by Disability Age 35 to 64
In terms of disability age 35 to 64, the demographic groups most similar to Immigrants from Australia are Immigrants from Indonesia (9.7%, a difference of 0.070%), Bulgarian (9.7%, a difference of 0.10%), Immigrants from Cuba (9.7%, a difference of 0.14%), Turkish (9.7%, a difference of 0.15%), and Immigrants from Turkey (9.7%, a difference of 0.22%).
| Demographics | Rating | Rank | Disability Age 35 to 64 |
| Immigrants | Asia | 100.0 /100 | #27 | Exceptional 9.5% |
| Immigrants | Pakistan | 100.0 /100 | #28 | Exceptional 9.5% |
| Immigrants | Ireland | 100.0 /100 | #29 | Exceptional 9.5% |
| Immigrants | Japan | 100.0 /100 | #30 | Exceptional 9.5% |
| Immigrants | Lithuania | 99.9 /100 | #31 | Exceptional 9.6% |
| Turks | 99.9 /100 | #32 | Exceptional 9.7% |
| Immigrants | Indonesia | 99.9 /100 | #33 | Exceptional 9.7% |
| Immigrants | Australia | 99.9 /100 | #34 | Exceptional 9.7% |
| Bulgarians | 99.9 /100 | #35 | Exceptional 9.7% |
| Immigrants | Cuba | 99.9 /100 | #36 | Exceptional 9.7% |
| Immigrants | Turkey | 99.9 /100 | #37 | Exceptional 9.7% |
| Egyptians | 99.9 /100 | #38 | Exceptional 9.7% |
| Immigrants | Belarus | 99.9 /100 | #39 | Exceptional 9.7% |
| Immigrants | Armenia | 99.9 /100 | #40 | Exceptional 9.7% |
| Israelis | 99.9 /100 | #41 | Exceptional 9.7% |