Cherokee vs Immigrants from Australia Disability Age 35 to 64
COMPARE
Cherokee
Immigrants from Australia
Disability Age 35 to 64
Disability Age 35 to 64 Comparison
Cherokee
Immigrants from Australia
15.5%
DISABILITY AGE 35 TO 64
0.0/ 100
METRIC RATING
329th/ 347
METRIC RANK
9.7%
DISABILITY AGE 35 TO 64
99.9/ 100
METRIC RATING
34th/ 347
METRIC RANK
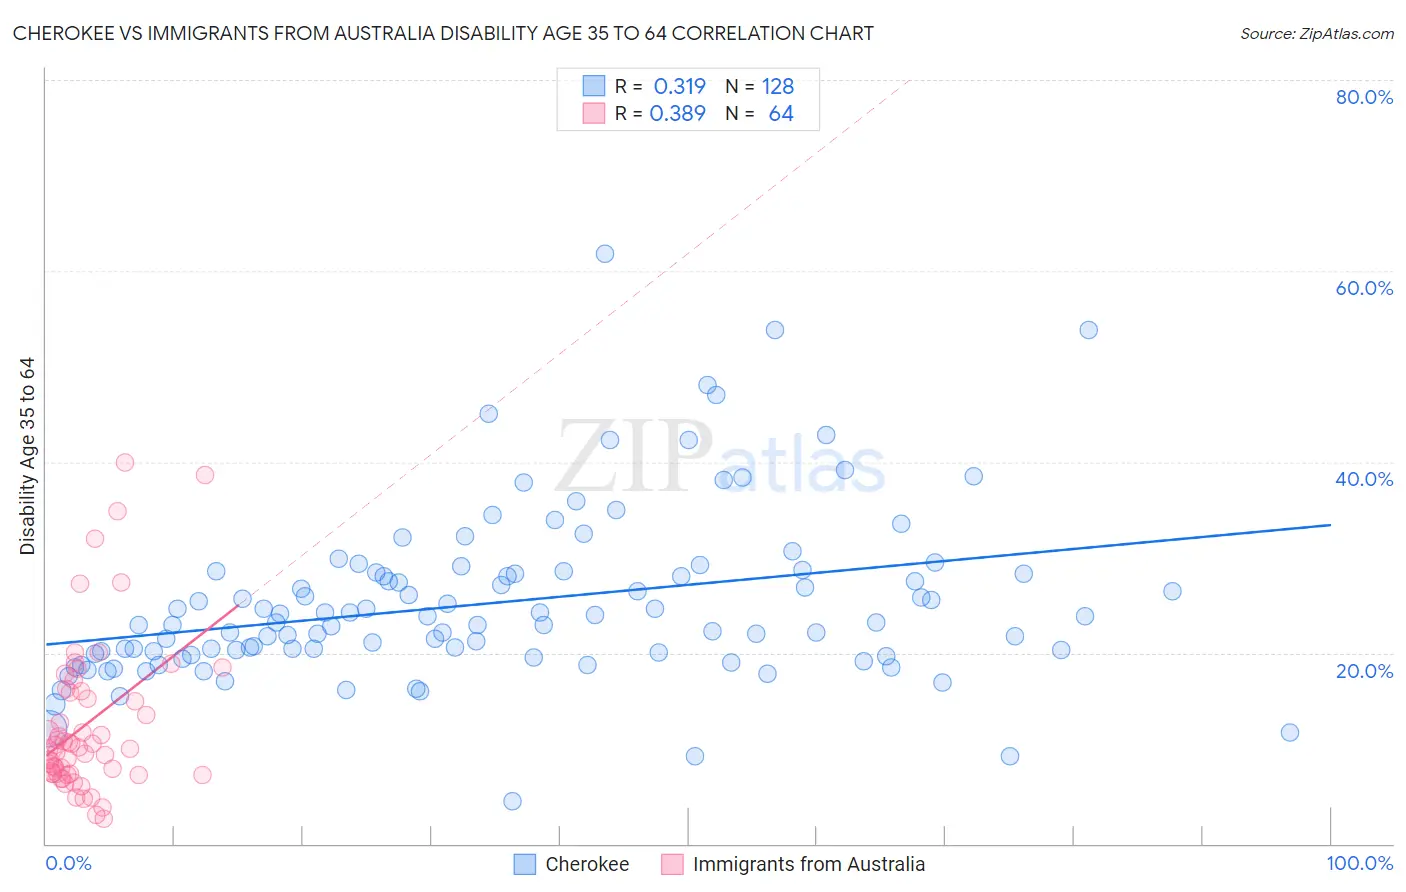
Cherokee vs Immigrants from Australia Disability Age 35 to 64 Correlation Chart
The statistical analysis conducted on geographies consisting of 493,305,636 people shows a mild positive correlation between the proportion of Cherokee and percentage of population with a disability between the ages 34 and 64 in the United States with a correlation coefficient (R) of 0.319 and weighted average of 15.5%. Similarly, the statistical analysis conducted on geographies consisting of 227,131,013 people shows a mild positive correlation between the proportion of Immigrants from Australia and percentage of population with a disability between the ages 34 and 64 in the United States with a correlation coefficient (R) of 0.389 and weighted average of 9.7%, a difference of 59.9%.
Disability Age 35 to 64 Correlation Summary
| Measurement | Cherokee | Immigrants from Australia |
| Minimum | 4.4% | 2.6% |
| Maximum | 61.8% | 40.0% |
| Range | 57.4% | 37.3% |
| Mean | 25.2% | 12.5% |
| Median | 23.1% | 10.0% |
| Interquartile 25% (IQ1) | 19.9% | 7.3% |
| Interquartile 75% (IQ3) | 28.4% | 15.9% |
| Interquartile Range (IQR) | 8.4% | 8.6% |
| Standard Deviation (Sample) | 9.0% | 8.1% |
| Standard Deviation (Population) | 9.0% | 8.1% |
Similar Demographics by Disability Age 35 to 64
Demographics Similar to Cherokee by Disability Age 35 to 64
In terms of disability age 35 to 64, the demographic groups most similar to Cherokee are Navajo (15.5%, a difference of 0.20%), Cajun (15.3%, a difference of 0.75%), Pueblo (15.3%, a difference of 0.93%), Native/Alaskan (15.3%, a difference of 0.95%), and Dutch West Indian (15.6%, a difference of 1.1%).
| Demographics | Rating | Rank | Disability Age 35 to 64 |
| Potawatomi | 0.0 /100 | #322 | Tragic 14.8% |
| Apache | 0.0 /100 | #323 | Tragic 14.9% |
| Chippewa | 0.0 /100 | #324 | Tragic 15.0% |
| Arapaho | 0.0 /100 | #325 | Tragic 15.1% |
| Natives/Alaskans | 0.0 /100 | #326 | Tragic 15.3% |
| Pueblo | 0.0 /100 | #327 | Tragic 15.3% |
| Cajuns | 0.0 /100 | #328 | Tragic 15.3% |
| Cherokee | 0.0 /100 | #329 | Tragic 15.5% |
| Navajo | 0.0 /100 | #330 | Tragic 15.5% |
| Dutch West Indians | 0.0 /100 | #331 | Tragic 15.6% |
| Alaskan Athabascans | 0.0 /100 | #332 | Tragic 15.7% |
| Yuman | 0.0 /100 | #333 | Tragic 15.8% |
| Colville | 0.0 /100 | #334 | Tragic 15.8% |
| Seminole | 0.0 /100 | #335 | Tragic 15.9% |
| Menominee | 0.0 /100 | #336 | Tragic 15.9% |
Demographics Similar to Immigrants from Australia by Disability Age 35 to 64
In terms of disability age 35 to 64, the demographic groups most similar to Immigrants from Australia are Immigrants from Indonesia (9.7%, a difference of 0.070%), Bulgarian (9.7%, a difference of 0.10%), Immigrants from Cuba (9.7%, a difference of 0.14%), Turkish (9.7%, a difference of 0.15%), and Immigrants from Turkey (9.7%, a difference of 0.22%).
| Demographics | Rating | Rank | Disability Age 35 to 64 |
| Immigrants | Asia | 100.0 /100 | #27 | Exceptional 9.5% |
| Immigrants | Pakistan | 100.0 /100 | #28 | Exceptional 9.5% |
| Immigrants | Ireland | 100.0 /100 | #29 | Exceptional 9.5% |
| Immigrants | Japan | 100.0 /100 | #30 | Exceptional 9.5% |
| Immigrants | Lithuania | 99.9 /100 | #31 | Exceptional 9.6% |
| Turks | 99.9 /100 | #32 | Exceptional 9.7% |
| Immigrants | Indonesia | 99.9 /100 | #33 | Exceptional 9.7% |
| Immigrants | Australia | 99.9 /100 | #34 | Exceptional 9.7% |
| Bulgarians | 99.9 /100 | #35 | Exceptional 9.7% |
| Immigrants | Cuba | 99.9 /100 | #36 | Exceptional 9.7% |
| Immigrants | Turkey | 99.9 /100 | #37 | Exceptional 9.7% |
| Egyptians | 99.9 /100 | #38 | Exceptional 9.7% |
| Immigrants | Belarus | 99.9 /100 | #39 | Exceptional 9.7% |
| Immigrants | Armenia | 99.9 /100 | #40 | Exceptional 9.7% |
| Israelis | 99.9 /100 | #41 | Exceptional 9.7% |