Taiwanese vs Immigrants from Uruguay Hearing Disability
COMPARE
Taiwanese
Immigrants from Uruguay
Hearing Disability
Hearing Disability Comparison
Taiwanese
Immigrants from Uruguay
2.8%
HEARING DISABILITY
94.8/ 100
METRIC RATING
102nd/ 347
METRIC RANK
2.7%
HEARING DISABILITY
97.2/ 100
METRIC RATING
81st/ 347
METRIC RANK
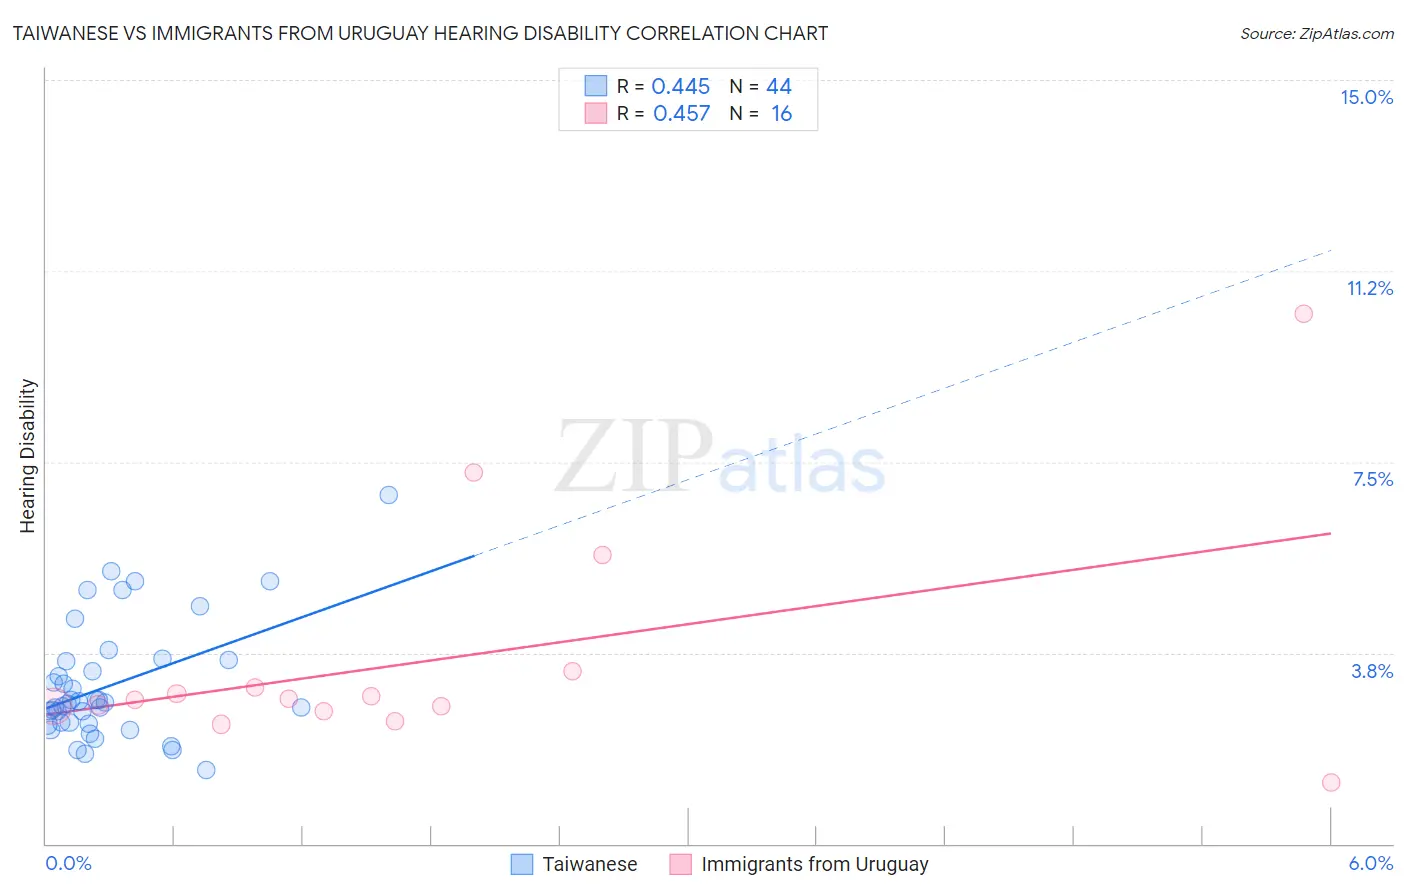
Taiwanese vs Immigrants from Uruguay Hearing Disability Correlation Chart
The statistical analysis conducted on geographies consisting of 31,724,936 people shows a moderate positive correlation between the proportion of Taiwanese and percentage of population with hearing disability in the United States with a correlation coefficient (R) of 0.445 and weighted average of 2.8%. Similarly, the statistical analysis conducted on geographies consisting of 133,251,950 people shows a moderate positive correlation between the proportion of Immigrants from Uruguay and percentage of population with hearing disability in the United States with a correlation coefficient (R) of 0.457 and weighted average of 2.7%, a difference of 1.6%.
Hearing Disability Correlation Summary
| Measurement | Taiwanese | Immigrants from Uruguay |
| Minimum | 1.5% | 1.2% |
| Maximum | 6.9% | 10.4% |
| Range | 5.4% | 9.2% |
| Mean | 3.1% | 3.6% |
| Median | 2.8% | 2.8% |
| Interquartile 25% (IQ1) | 2.4% | 2.6% |
| Interquartile 75% (IQ3) | 3.6% | 3.2% |
| Interquartile Range (IQR) | 1.2% | 0.58% |
| Standard Deviation (Sample) | 1.2% | 2.3% |
| Standard Deviation (Population) | 1.1% | 2.2% |
Similar Demographics by Hearing Disability
Demographics Similar to Taiwanese by Hearing Disability
In terms of hearing disability, the demographic groups most similar to Taiwanese are Immigrants from Spain (2.8%, a difference of 0.010%), Immigrants from Indonesia (2.8%, a difference of 0.050%), Immigrants from Eastern Africa (2.8%, a difference of 0.070%), Immigrants from Guatemala (2.8%, a difference of 0.12%), and Immigrants from Honduras (2.8%, a difference of 0.16%).
| Demographics | Rating | Rank | Hearing Disability |
| Israelis | 95.9 /100 | #95 | Exceptional 2.8% |
| Immigrants | Somalia | 95.5 /100 | #96 | Exceptional 2.8% |
| Immigrants | Afghanistan | 95.3 /100 | #97 | Exceptional 2.8% |
| Immigrants | Honduras | 95.1 /100 | #98 | Exceptional 2.8% |
| Immigrants | Guatemala | 95.1 /100 | #99 | Exceptional 2.8% |
| Immigrants | Eastern Africa | 95.0 /100 | #100 | Exceptional 2.8% |
| Immigrants | Spain | 94.9 /100 | #101 | Exceptional 2.8% |
| Taiwanese | 94.8 /100 | #102 | Exceptional 2.8% |
| Immigrants | Indonesia | 94.7 /100 | #103 | Exceptional 2.8% |
| Burmese | 94.2 /100 | #104 | Exceptional 2.8% |
| Moroccans | 93.9 /100 | #105 | Exceptional 2.8% |
| Hondurans | 93.4 /100 | #106 | Exceptional 2.8% |
| Immigrants | Chile | 93.4 /100 | #107 | Exceptional 2.8% |
| Guatemalans | 93.2 /100 | #108 | Exceptional 2.8% |
| Turks | 93.0 /100 | #109 | Exceptional 2.8% |
Demographics Similar to Immigrants from Uruguay by Hearing Disability
In terms of hearing disability, the demographic groups most similar to Immigrants from Uruguay are Immigrants from Armenia (2.7%, a difference of 0.020%), Immigrants from Asia (2.7%, a difference of 0.030%), Immigrants from Cuba (2.7%, a difference of 0.030%), Colombian (2.7%, a difference of 0.21%), and Mongolian (2.7%, a difference of 0.23%).
| Demographics | Rating | Rank | Hearing Disability |
| Immigrants | Korea | 97.5 /100 | #74 | Exceptional 2.7% |
| Immigrants | Saudi Arabia | 97.5 /100 | #75 | Exceptional 2.7% |
| Asians | 97.5 /100 | #76 | Exceptional 2.7% |
| Immigrants | Malaysia | 97.5 /100 | #77 | Exceptional 2.7% |
| Mongolians | 97.4 /100 | #78 | Exceptional 2.7% |
| Colombians | 97.4 /100 | #79 | Exceptional 2.7% |
| Immigrants | Asia | 97.2 /100 | #80 | Exceptional 2.7% |
| Immigrants | Uruguay | 97.2 /100 | #81 | Exceptional 2.7% |
| Immigrants | Armenia | 97.2 /100 | #82 | Exceptional 2.7% |
| Immigrants | Cuba | 97.2 /100 | #83 | Exceptional 2.7% |
| Immigrants | Argentina | 97.0 /100 | #84 | Exceptional 2.8% |
| Immigrants | Northern Africa | 96.9 /100 | #85 | Exceptional 2.8% |
| Immigrants | Iran | 96.8 /100 | #86 | Exceptional 2.8% |
| Somalis | 96.7 /100 | #87 | Exceptional 2.8% |
| Immigrants | Turkey | 96.7 /100 | #88 | Exceptional 2.8% |