Immigrants from Belize vs Immigrants from Uruguay Hearing Disability
COMPARE
Immigrants from Belize
Immigrants from Uruguay
Hearing Disability
Hearing Disability Comparison
Immigrants from Belize
Immigrants from Uruguay
2.7%
HEARING DISABILITY
98.2/ 100
METRIC RATING
66th/ 347
METRIC RANK
2.7%
HEARING DISABILITY
97.2/ 100
METRIC RATING
81st/ 347
METRIC RANK
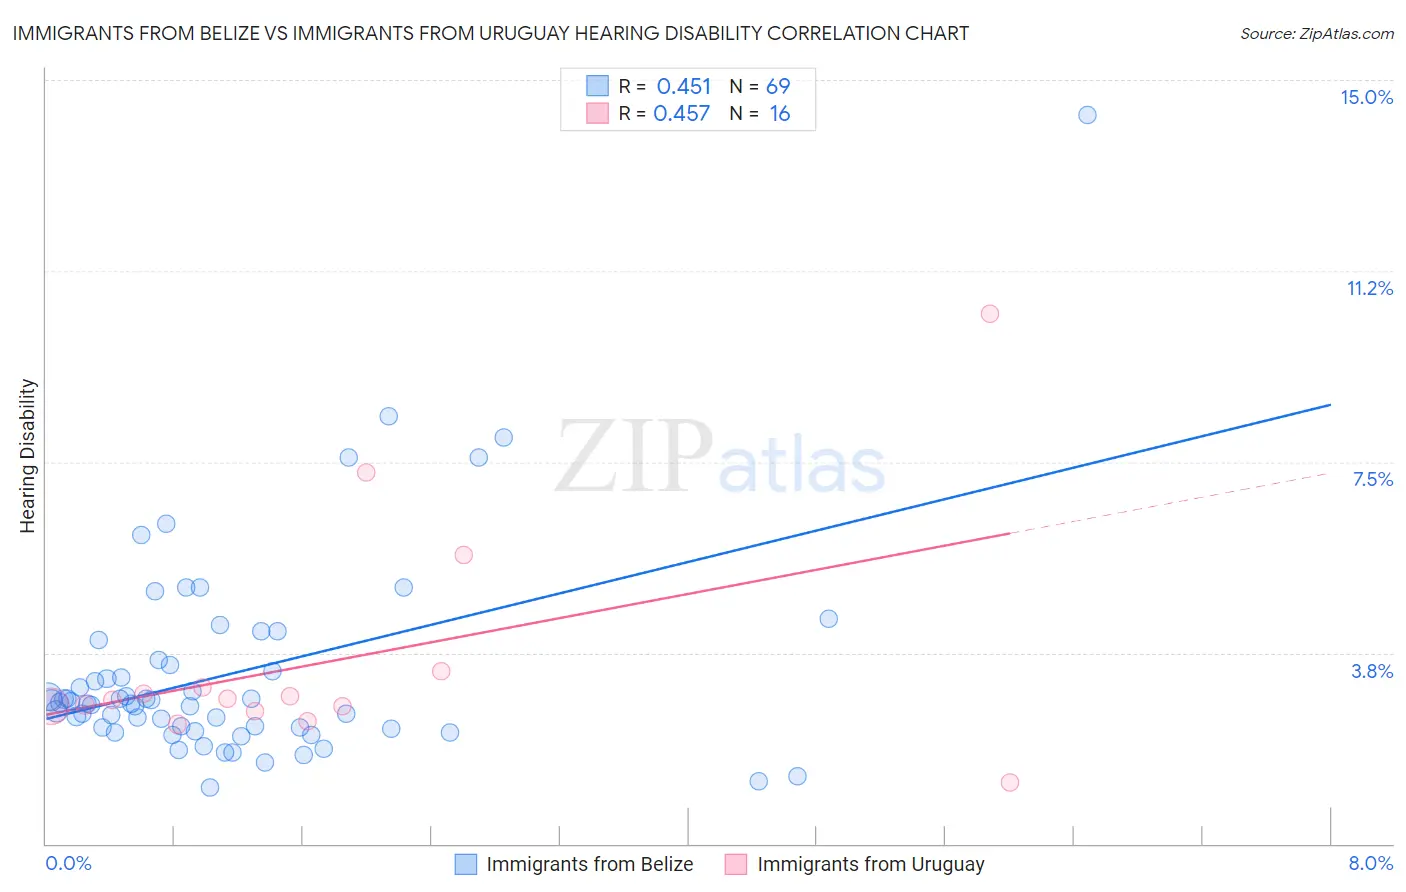
Immigrants from Belize vs Immigrants from Uruguay Hearing Disability Correlation Chart
The statistical analysis conducted on geographies consisting of 130,272,611 people shows a moderate positive correlation between the proportion of Immigrants from Belize and percentage of population with hearing disability in the United States with a correlation coefficient (R) of 0.451 and weighted average of 2.7%. Similarly, the statistical analysis conducted on geographies consisting of 133,251,950 people shows a moderate positive correlation between the proportion of Immigrants from Uruguay and percentage of population with hearing disability in the United States with a correlation coefficient (R) of 0.457 and weighted average of 2.7%, a difference of 1.2%.
Hearing Disability Correlation Summary
| Measurement | Immigrants from Belize | Immigrants from Uruguay |
| Minimum | 1.1% | 1.2% |
| Maximum | 14.3% | 10.4% |
| Range | 13.2% | 9.2% |
| Mean | 3.4% | 3.6% |
| Median | 2.8% | 2.8% |
| Interquartile 25% (IQ1) | 2.3% | 2.6% |
| Interquartile 75% (IQ3) | 3.6% | 3.2% |
| Interquartile Range (IQR) | 1.3% | 0.58% |
| Standard Deviation (Sample) | 2.1% | 2.3% |
| Standard Deviation (Population) | 2.0% | 2.2% |
Demographics Similar to Immigrants from Belize and Immigrants from Uruguay by Hearing Disability
In terms of hearing disability, the demographic groups most similar to Immigrants from Belize are Immigrants from Nepal (2.7%, a difference of 0.12%), Immigrants from Sri Lanka (2.7%, a difference of 0.21%), Egyptian (2.7%, a difference of 0.23%), Indian (Asian) (2.7%, a difference of 0.26%), and Immigrants from Africa (2.7%, a difference of 0.36%). Similarly, the demographic groups most similar to Immigrants from Uruguay are Immigrants from Armenia (2.7%, a difference of 0.020%), Immigrants from Asia (2.7%, a difference of 0.030%), Immigrants from Cuba (2.7%, a difference of 0.030%), Colombian (2.7%, a difference of 0.21%), and Mongolian (2.7%, a difference of 0.23%).
| Demographics | Rating | Rank | Hearing Disability |
| Indians (Asian) | 98.4 /100 | #63 | Exceptional 2.7% |
| Immigrants | Sri Lanka | 98.4 /100 | #64 | Exceptional 2.7% |
| Immigrants | Nepal | 98.3 /100 | #65 | Exceptional 2.7% |
| Immigrants | Belize | 98.2 /100 | #66 | Exceptional 2.7% |
| Egyptians | 98.1 /100 | #67 | Exceptional 2.7% |
| Immigrants | Africa | 98.0 /100 | #68 | Exceptional 2.7% |
| Nicaraguans | 97.9 /100 | #69 | Exceptional 2.7% |
| Peruvians | 97.7 /100 | #70 | Exceptional 2.7% |
| Central Americans | 97.7 /100 | #71 | Exceptional 2.7% |
| Afghans | 97.6 /100 | #72 | Exceptional 2.7% |
| Argentineans | 97.5 /100 | #73 | Exceptional 2.7% |
| Immigrants | Korea | 97.5 /100 | #74 | Exceptional 2.7% |
| Immigrants | Saudi Arabia | 97.5 /100 | #75 | Exceptional 2.7% |
| Asians | 97.5 /100 | #76 | Exceptional 2.7% |
| Immigrants | Malaysia | 97.5 /100 | #77 | Exceptional 2.7% |
| Mongolians | 97.4 /100 | #78 | Exceptional 2.7% |
| Colombians | 97.4 /100 | #79 | Exceptional 2.7% |
| Immigrants | Asia | 97.2 /100 | #80 | Exceptional 2.7% |
| Immigrants | Uruguay | 97.2 /100 | #81 | Exceptional 2.7% |
| Immigrants | Armenia | 97.2 /100 | #82 | Exceptional 2.7% |
| Immigrants | Cuba | 97.2 /100 | #83 | Exceptional 2.7% |