Costa Rican vs Cypriot Disability Age Under 5
COMPARE
Costa Rican
Cypriot
Disability Age Under 5
Disability Age Under 5 Comparison
Costa Ricans
Cypriots
1.4%
DISABILITY AGE UNDER 5
0.3/ 100
METRIC RATING
258th/ 347
METRIC RANK
1.3%
DISABILITY AGE UNDER 5
14.9/ 100
METRIC RATING
217th/ 347
METRIC RANK
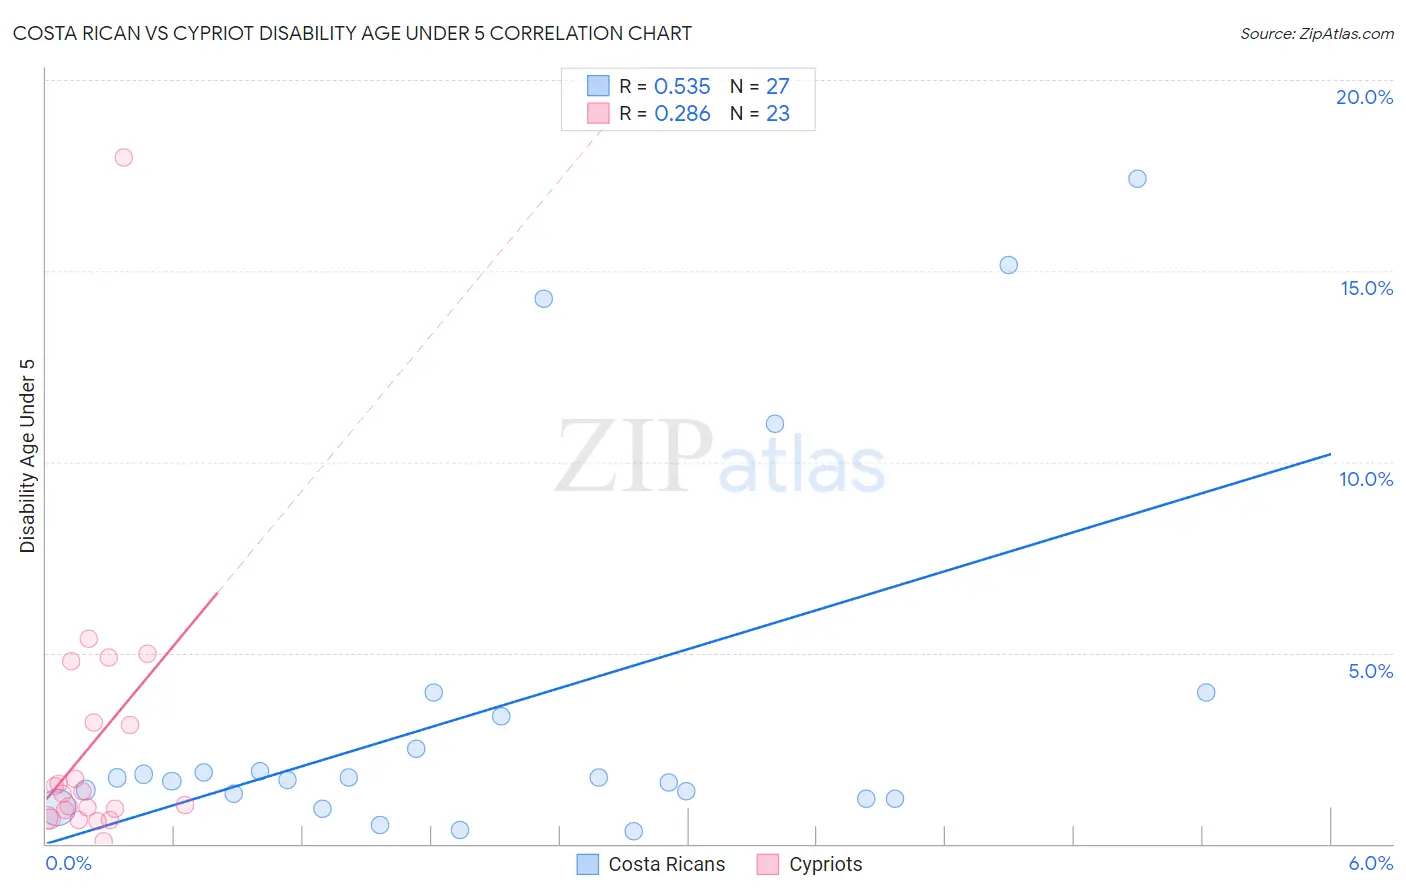
Costa Rican vs Cypriot Disability Age Under 5 Correlation Chart
The statistical analysis conducted on geographies consisting of 157,524,003 people shows a substantial positive correlation between the proportion of Costa Ricans and percentage of population with a disability under the age of 5 in the United States with a correlation coefficient (R) of 0.535 and weighted average of 1.4%. Similarly, the statistical analysis conducted on geographies consisting of 48,448,194 people shows a weak positive correlation between the proportion of Cypriots and percentage of population with a disability under the age of 5 in the United States with a correlation coefficient (R) of 0.286 and weighted average of 1.3%, a difference of 8.8%.
Disability Age Under 5 Correlation Summary
| Measurement | Costa Rican | Cypriot |
| Minimum | 0.32% | 0.058% |
| Maximum | 17.4% | 18.0% |
| Range | 17.1% | 17.9% |
| Mean | 3.6% | 2.6% |
| Median | 1.7% | 1.3% |
| Interquartile 25% (IQ1) | 1.2% | 0.68% |
| Interquartile 75% (IQ3) | 3.4% | 3.2% |
| Interquartile Range (IQR) | 2.2% | 2.5% |
| Standard Deviation (Sample) | 4.8% | 3.7% |
| Standard Deviation (Population) | 4.7% | 3.6% |
Similar Demographics by Disability Age Under 5
Demographics Similar to Costa Ricans by Disability Age Under 5
In terms of disability age under 5, the demographic groups most similar to Costa Ricans are Immigrants from Southern Europe (1.4%, a difference of 0.16%), Slovene (1.4%, a difference of 0.19%), Slavic (1.4%, a difference of 0.37%), Immigrants from Netherlands (1.4%, a difference of 1.0%), and Immigrants from Western Europe (1.4%, a difference of 1.1%).
| Demographics | Rating | Rank | Disability Age Under 5 |
| Immigrants | Hungary | 1.0 /100 | #251 | Tragic 1.4% |
| Immigrants | Scotland | 0.9 /100 | #252 | Tragic 1.4% |
| Australians | 0.7 /100 | #253 | Tragic 1.4% |
| Immigrants | Brazil | 0.7 /100 | #254 | Tragic 1.4% |
| Immigrants | Liberia | 0.6 /100 | #255 | Tragic 1.4% |
| Immigrants | Western Europe | 0.5 /100 | #256 | Tragic 1.4% |
| Slovenes | 0.3 /100 | #257 | Tragic 1.4% |
| Costa Ricans | 0.3 /100 | #258 | Tragic 1.4% |
| Immigrants | Southern Europe | 0.3 /100 | #259 | Tragic 1.4% |
| Slavs | 0.3 /100 | #260 | Tragic 1.4% |
| Immigrants | Netherlands | 0.2 /100 | #261 | Tragic 1.4% |
| Immigrants | Dominica | 0.2 /100 | #262 | Tragic 1.4% |
| Spanish | 0.2 /100 | #263 | Tragic 1.4% |
| Yugoslavians | 0.1 /100 | #264 | Tragic 1.4% |
| Carpatho Rusyns | 0.1 /100 | #265 | Tragic 1.4% |
Demographics Similar to Cypriots by Disability Age Under 5
In terms of disability age under 5, the demographic groups most similar to Cypriots are Bangladeshi (1.3%, a difference of 0.10%), Syrian (1.3%, a difference of 0.20%), Malaysian (1.3%, a difference of 0.31%), Immigrants from Chile (1.3%, a difference of 0.37%), and Immigrants from Sudan (1.3%, a difference of 0.60%).
| Demographics | Rating | Rank | Disability Age Under 5 |
| Pakistanis | 19.4 /100 | #210 | Poor 1.3% |
| Immigrants | Greece | 19.1 /100 | #211 | Poor 1.3% |
| Chileans | 18.8 /100 | #212 | Poor 1.3% |
| Immigrants | Sudan | 18.7 /100 | #213 | Poor 1.3% |
| Immigrants | Chile | 17.2 /100 | #214 | Poor 1.3% |
| Syrians | 16.1 /100 | #215 | Poor 1.3% |
| Bangladeshis | 15.5 /100 | #216 | Poor 1.3% |
| Cypriots | 14.9 /100 | #217 | Poor 1.3% |
| Malaysians | 13.2 /100 | #218 | Poor 1.3% |
| Immigrants | Croatia | 11.2 /100 | #219 | Poor 1.3% |
| Serbians | 9.6 /100 | #220 | Tragic 1.3% |
| Sub-Saharan Africans | 8.3 /100 | #221 | Tragic 1.3% |
| Ukrainians | 8.3 /100 | #222 | Tragic 1.3% |
| Hispanics or Latinos | 7.7 /100 | #223 | Tragic 1.3% |
| Latvians | 7.1 /100 | #224 | Tragic 1.3% |