Costa Rican vs Immigrants from Latin America Disability Age Under 5
COMPARE
Costa Rican
Immigrants from Latin America
Disability Age Under 5
Disability Age Under 5 Comparison
Costa Ricans
Immigrants from Latin America
1.4%
DISABILITY AGE UNDER 5
0.3/ 100
METRIC RATING
258th/ 347
METRIC RANK
1.2%
DISABILITY AGE UNDER 5
65.8/ 100
METRIC RATING
160th/ 347
METRIC RANK
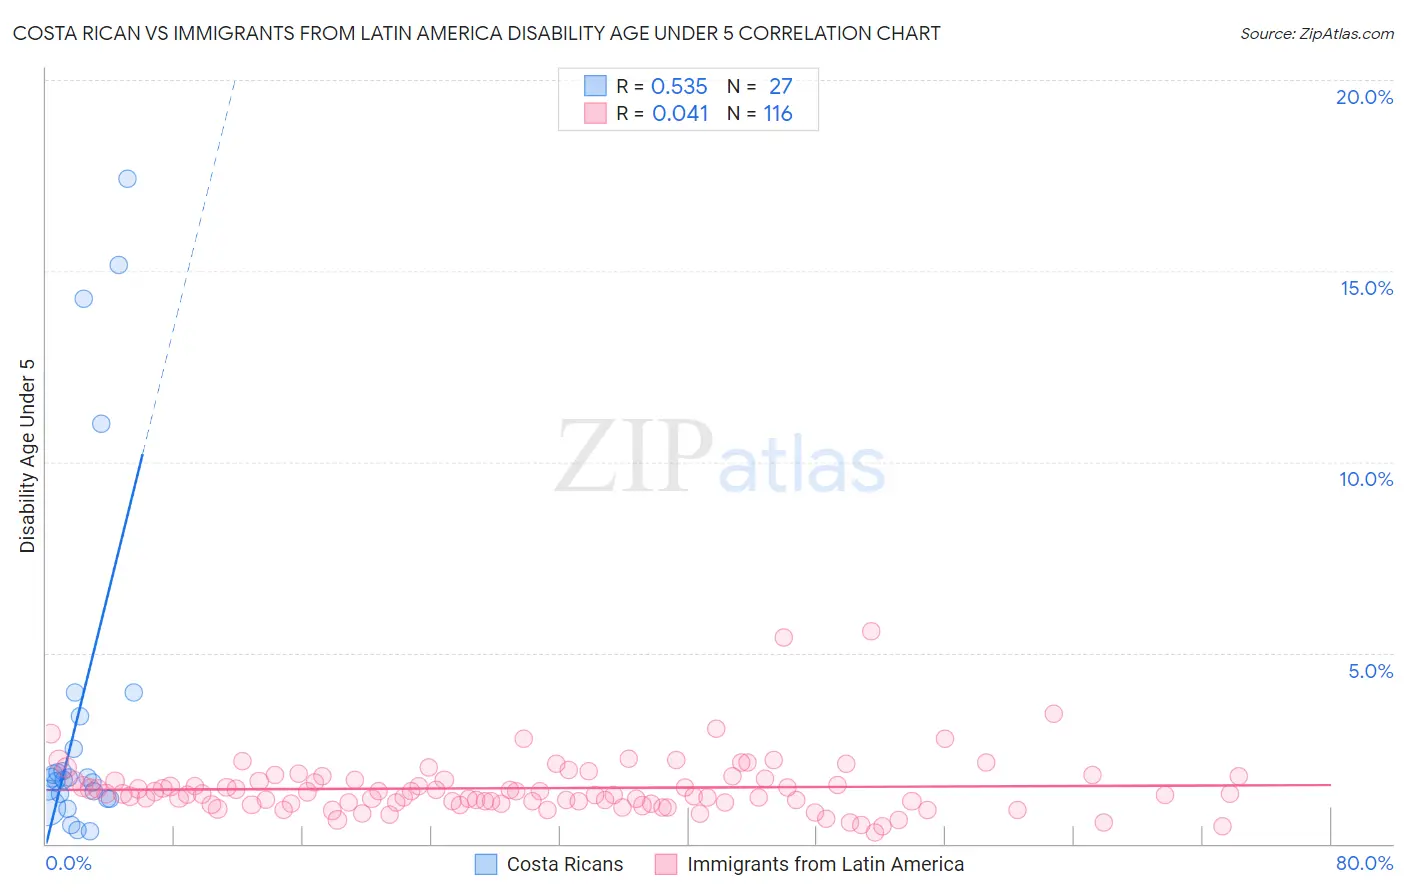
Costa Rican vs Immigrants from Latin America Disability Age Under 5 Correlation Chart
The statistical analysis conducted on geographies consisting of 157,524,003 people shows a substantial positive correlation between the proportion of Costa Ricans and percentage of population with a disability under the age of 5 in the United States with a correlation coefficient (R) of 0.535 and weighted average of 1.4%. Similarly, the statistical analysis conducted on geographies consisting of 260,180,620 people shows no correlation between the proportion of Immigrants from Latin America and percentage of population with a disability under the age of 5 in the United States with a correlation coefficient (R) of 0.041 and weighted average of 1.2%, a difference of 14.8%.
Disability Age Under 5 Correlation Summary
| Measurement | Costa Rican | Immigrants from Latin America |
| Minimum | 0.32% | 0.28% |
| Maximum | 17.4% | 5.6% |
| Range | 17.1% | 5.3% |
| Mean | 3.6% | 1.5% |
| Median | 1.7% | 1.3% |
| Interquartile 25% (IQ1) | 1.2% | 1.1% |
| Interquartile 75% (IQ3) | 3.4% | 1.7% |
| Interquartile Range (IQR) | 2.2% | 0.61% |
| Standard Deviation (Sample) | 4.8% | 0.76% |
| Standard Deviation (Population) | 4.7% | 0.76% |
Similar Demographics by Disability Age Under 5
Demographics Similar to Costa Ricans by Disability Age Under 5
In terms of disability age under 5, the demographic groups most similar to Costa Ricans are Immigrants from Southern Europe (1.4%, a difference of 0.16%), Slovene (1.4%, a difference of 0.19%), Slavic (1.4%, a difference of 0.37%), Immigrants from Netherlands (1.4%, a difference of 1.0%), and Immigrants from Western Europe (1.4%, a difference of 1.1%).
| Demographics | Rating | Rank | Disability Age Under 5 |
| Immigrants | Hungary | 1.0 /100 | #251 | Tragic 1.4% |
| Immigrants | Scotland | 0.9 /100 | #252 | Tragic 1.4% |
| Australians | 0.7 /100 | #253 | Tragic 1.4% |
| Immigrants | Brazil | 0.7 /100 | #254 | Tragic 1.4% |
| Immigrants | Liberia | 0.6 /100 | #255 | Tragic 1.4% |
| Immigrants | Western Europe | 0.5 /100 | #256 | Tragic 1.4% |
| Slovenes | 0.3 /100 | #257 | Tragic 1.4% |
| Costa Ricans | 0.3 /100 | #258 | Tragic 1.4% |
| Immigrants | Southern Europe | 0.3 /100 | #259 | Tragic 1.4% |
| Slavs | 0.3 /100 | #260 | Tragic 1.4% |
| Immigrants | Netherlands | 0.2 /100 | #261 | Tragic 1.4% |
| Immigrants | Dominica | 0.2 /100 | #262 | Tragic 1.4% |
| Spanish | 0.2 /100 | #263 | Tragic 1.4% |
| Yugoslavians | 0.1 /100 | #264 | Tragic 1.4% |
| Carpatho Rusyns | 0.1 /100 | #265 | Tragic 1.4% |
Demographics Similar to Immigrants from Latin America by Disability Age Under 5
In terms of disability age under 5, the demographic groups most similar to Immigrants from Latin America are Colombian (1.2%, a difference of 0.0%), Arab (1.2%, a difference of 0.060%), Immigrants from Africa (1.2%, a difference of 0.070%), Immigrants from South America (1.2%, a difference of 0.12%), and Guatemalan (1.2%, a difference of 0.22%).
| Demographics | Rating | Rank | Disability Age Under 5 |
| Immigrants | Thailand | 69.4 /100 | #153 | Good 1.2% |
| Uruguayans | 68.8 /100 | #154 | Good 1.2% |
| Immigrants | Ghana | 68.7 /100 | #155 | Good 1.2% |
| Hawaiians | 68.5 /100 | #156 | Good 1.2% |
| Immigrants | South America | 67.0 /100 | #157 | Good 1.2% |
| Arabs | 66.4 /100 | #158 | Good 1.2% |
| Colombians | 65.8 /100 | #159 | Good 1.2% |
| Immigrants | Latin America | 65.8 /100 | #160 | Good 1.2% |
| Immigrants | Africa | 65.1 /100 | #161 | Good 1.2% |
| Guatemalans | 63.6 /100 | #162 | Good 1.2% |
| Immigrants | Guatemala | 63.2 /100 | #163 | Good 1.2% |
| Laotians | 62.8 /100 | #164 | Good 1.2% |
| Immigrants | Kuwait | 62.6 /100 | #165 | Good 1.2% |
| Immigrants | Central America | 61.4 /100 | #166 | Good 1.2% |
| Immigrants | Argentina | 60.2 /100 | #167 | Good 1.2% |