Costa Rican vs Italian Disability Age 35 to 64
COMPARE
Costa Rican
Italian
Disability Age 35 to 64
Disability Age 35 to 64 Comparison
Costa Ricans
Italians
10.7%
DISABILITY AGE 35 TO 64
91.4/ 100
METRIC RATING
139th/ 347
METRIC RANK
11.2%
DISABILITY AGE 35 TO 64
55.6/ 100
METRIC RATING
172nd/ 347
METRIC RANK
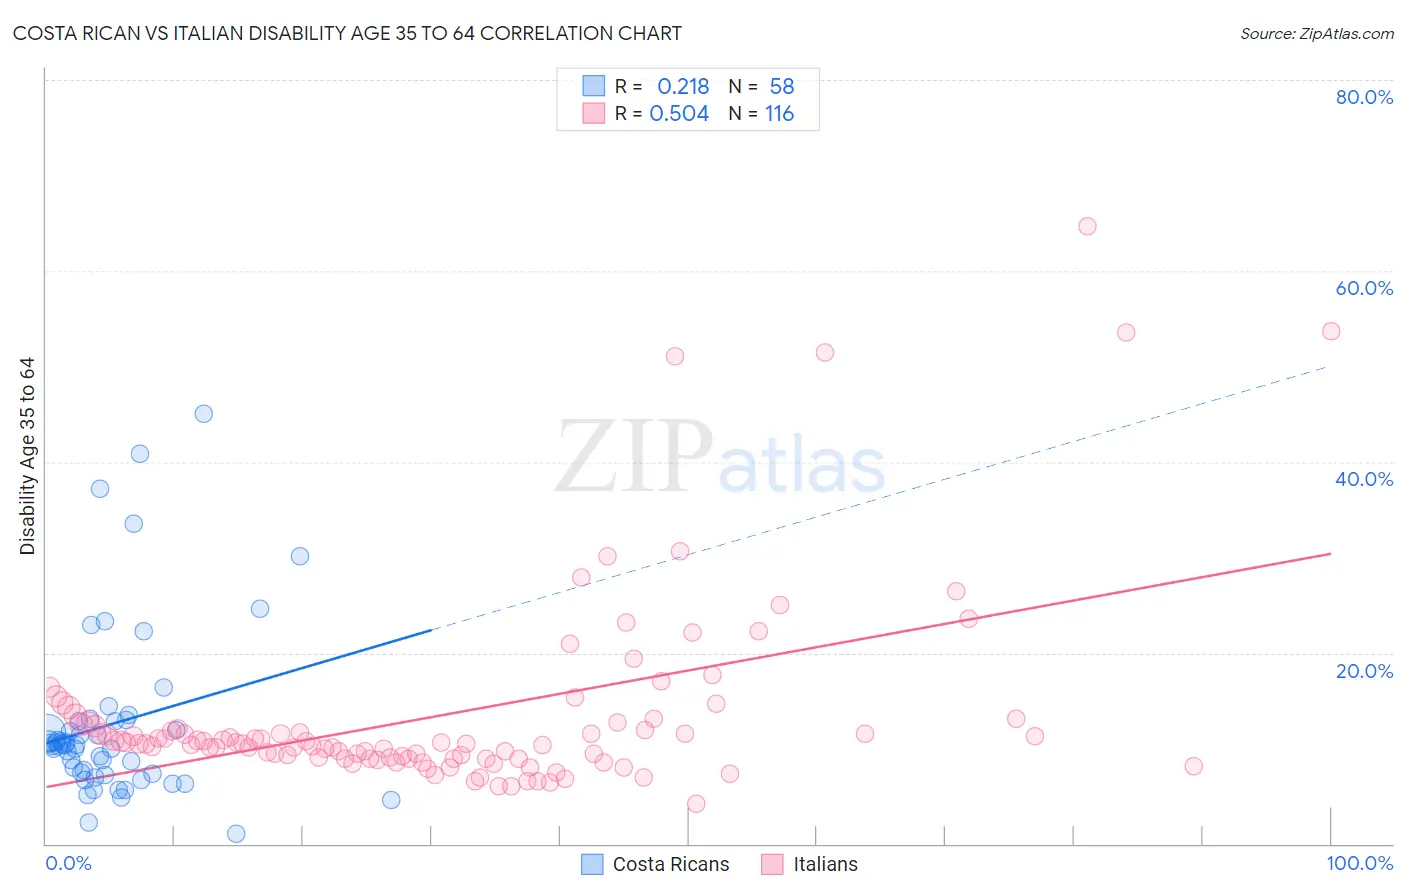
Costa Rican vs Italian Disability Age 35 to 64 Correlation Chart
The statistical analysis conducted on geographies consisting of 253,472,399 people shows a weak positive correlation between the proportion of Costa Ricans and percentage of population with a disability between the ages 34 and 64 in the United States with a correlation coefficient (R) of 0.218 and weighted average of 10.7%. Similarly, the statistical analysis conducted on geographies consisting of 573,871,626 people shows a substantial positive correlation between the proportion of Italians and percentage of population with a disability between the ages 34 and 64 in the United States with a correlation coefficient (R) of 0.504 and weighted average of 11.2%, a difference of 4.5%.
Disability Age 35 to 64 Correlation Summary
| Measurement | Costa Rican | Italian |
| Minimum | 1.1% | 4.2% |
| Maximum | 45.1% | 64.6% |
| Range | 44.0% | 60.5% |
| Mean | 12.6% | 13.5% |
| Median | 10.3% | 10.5% |
| Interquartile 25% (IQ1) | 7.4% | 8.9% |
| Interquartile 75% (IQ3) | 12.9% | 12.6% |
| Interquartile Range (IQR) | 5.5% | 3.6% |
| Standard Deviation (Sample) | 9.1% | 10.1% |
| Standard Deviation (Population) | 9.0% | 10.1% |
Similar Demographics by Disability Age 35 to 64
Demographics Similar to Costa Ricans by Disability Age 35 to 64
In terms of disability age 35 to 64, the demographic groups most similar to Costa Ricans are Immigrants from Southern Europe (10.7%, a difference of 0.010%), Immigrants from Scotland (10.7%, a difference of 0.050%), Immigrants from Costa Rica (10.7%, a difference of 0.060%), Salvadoran (10.7%, a difference of 0.13%), and Australian (10.8%, a difference of 0.18%).
| Demographics | Rating | Rank | Disability Age 35 to 64 |
| Immigrants | Albania | 92.5 /100 | #132 | Exceptional 10.7% |
| Immigrants | Immigrants | 92.5 /100 | #133 | Exceptional 10.7% |
| Immigrants | Ecuador | 92.5 /100 | #134 | Exceptional 10.7% |
| Greeks | 92.3 /100 | #135 | Exceptional 10.7% |
| Salvadorans | 91.9 /100 | #136 | Exceptional 10.7% |
| Immigrants | Costa Rica | 91.7 /100 | #137 | Exceptional 10.7% |
| Immigrants | Southern Europe | 91.5 /100 | #138 | Exceptional 10.7% |
| Costa Ricans | 91.4 /100 | #139 | Exceptional 10.7% |
| Immigrants | Scotland | 91.3 /100 | #140 | Exceptional 10.7% |
| Australians | 90.7 /100 | #141 | Exceptional 10.8% |
| Immigrants | Saudi Arabia | 90.6 /100 | #142 | Exceptional 10.8% |
| Sierra Leoneans | 89.7 /100 | #143 | Excellent 10.8% |
| Lithuanians | 88.7 /100 | #144 | Excellent 10.8% |
| Immigrants | Bangladesh | 85.6 /100 | #145 | Excellent 10.9% |
| South American Indians | 83.5 /100 | #146 | Excellent 10.9% |
Demographics Similar to Italians by Disability Age 35 to 64
In terms of disability age 35 to 64, the demographic groups most similar to Italians are Immigrants from Trinidad and Tobago (11.2%, a difference of 0.020%), Immigrants from Uganda (11.2%, a difference of 0.19%), Haitian (11.2%, a difference of 0.27%), Central American (11.2%, a difference of 0.29%), and Lebanese (11.3%, a difference of 0.31%).
| Demographics | Rating | Rank | Disability Age 35 to 64 |
| Immigrants | Western Europe | 65.2 /100 | #165 | Good 11.1% |
| Immigrants | Haiti | 63.8 /100 | #166 | Good 11.1% |
| Austrians | 63.2 /100 | #167 | Good 11.1% |
| Central Americans | 59.1 /100 | #168 | Average 11.2% |
| Haitians | 59.0 /100 | #169 | Average 11.2% |
| Immigrants | Uganda | 58.0 /100 | #170 | Average 11.2% |
| Immigrants | Trinidad and Tobago | 55.9 /100 | #171 | Average 11.2% |
| Italians | 55.6 /100 | #172 | Average 11.2% |
| Lebanese | 51.8 /100 | #173 | Average 11.3% |
| Immigrants | Fiji | 50.0 /100 | #174 | Average 11.3% |
| Czechs | 47.9 /100 | #175 | Average 11.3% |
| Ugandans | 43.7 /100 | #176 | Average 11.3% |
| Immigrants | Eastern Africa | 42.2 /100 | #177 | Average 11.3% |
| Poles | 42.0 /100 | #178 | Average 11.3% |
| Immigrants | Barbados | 41.6 /100 | #179 | Average 11.3% |