Luxembourger vs Estonian Disability Age 35 to 64
COMPARE
Luxembourger
Estonian
Disability Age 35 to 64
Disability Age 35 to 64 Comparison
Luxembourgers
Estonians
10.6%
DISABILITY AGE 35 TO 64
95.5/ 100
METRIC RATING
119th/ 347
METRIC RANK
10.6%
DISABILITY AGE 35 TO 64
94.5/ 100
METRIC RATING
124th/ 347
METRIC RANK
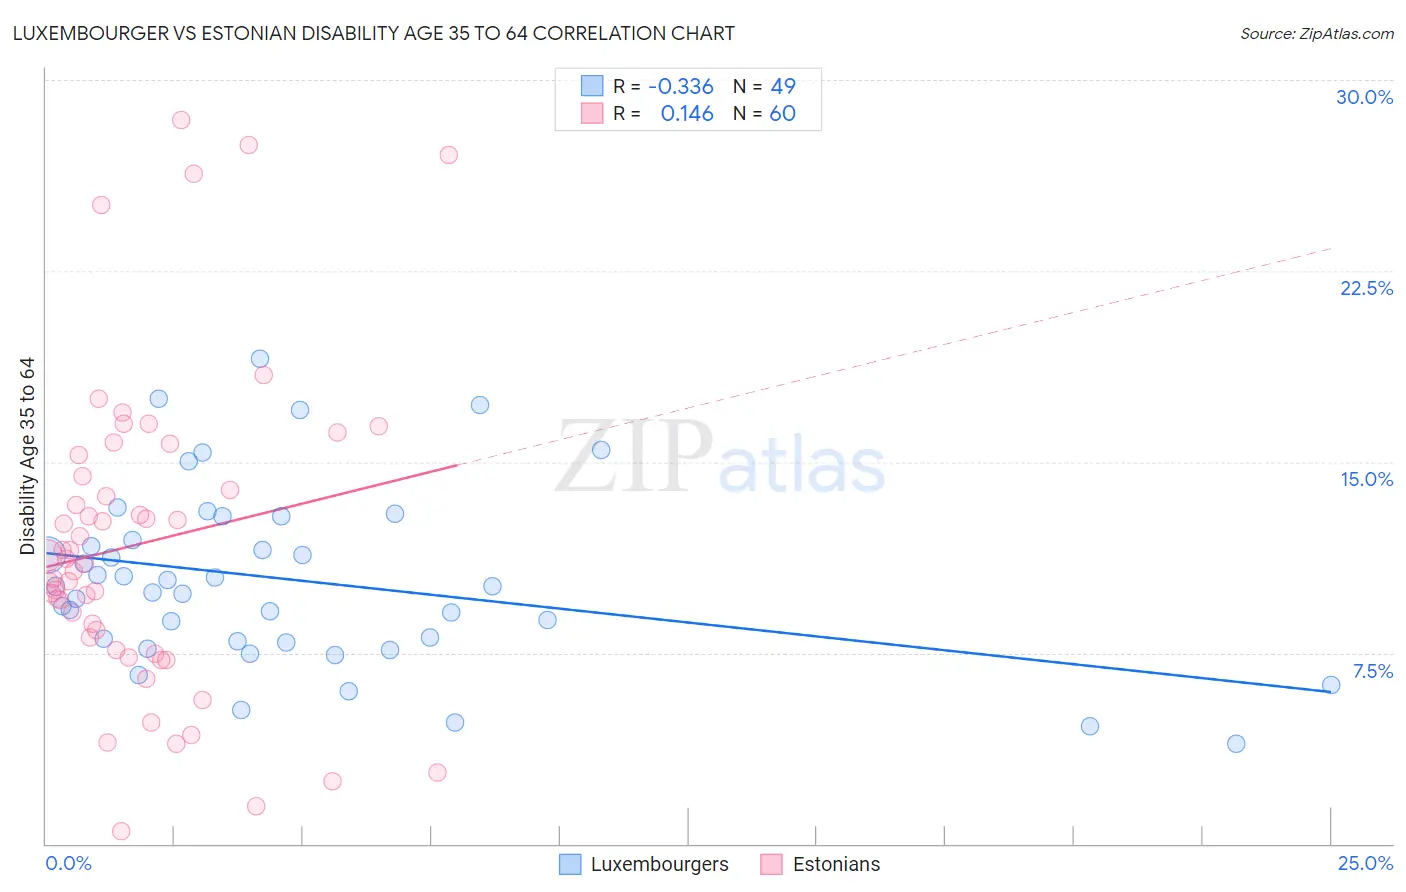
Luxembourger vs Estonian Disability Age 35 to 64 Correlation Chart
The statistical analysis conducted on geographies consisting of 144,643,404 people shows a mild negative correlation between the proportion of Luxembourgers and percentage of population with a disability between the ages 34 and 64 in the United States with a correlation coefficient (R) of -0.336 and weighted average of 10.6%. Similarly, the statistical analysis conducted on geographies consisting of 123,493,933 people shows a poor positive correlation between the proportion of Estonians and percentage of population with a disability between the ages 34 and 64 in the United States with a correlation coefficient (R) of 0.146 and weighted average of 10.6%, a difference of 0.43%.
Disability Age 35 to 64 Correlation Summary
| Measurement | Luxembourger | Estonian |
| Minimum | 3.9% | 0.48% |
| Maximum | 19.1% | 28.4% |
| Range | 15.1% | 28.0% |
| Mean | 10.3% | 11.8% |
| Median | 10.1% | 11.1% |
| Interquartile 25% (IQ1) | 7.9% | 7.9% |
| Interquartile 75% (IQ3) | 12.4% | 14.9% |
| Interquartile Range (IQR) | 4.4% | 7.0% |
| Standard Deviation (Sample) | 3.5% | 6.2% |
| Standard Deviation (Population) | 3.4% | 6.1% |
Demographics Similar to Luxembourgers and Estonians by Disability Age 35 to 64
In terms of disability age 35 to 64, the demographic groups most similar to Luxembourgers are Vietnamese (10.6%, a difference of 0.020%), Immigrants from Moldova (10.6%, a difference of 0.050%), Immigrants from South Eastern Asia (10.6%, a difference of 0.14%), Romanian (10.6%, a difference of 0.19%), and Immigrants from Norway (10.6%, a difference of 0.22%). Similarly, the demographic groups most similar to Estonians are Albanian (10.6%, a difference of 0.10%), Maltese (10.6%, a difference of 0.12%), Immigrants from Afghanistan (10.6%, a difference of 0.16%), Immigrants from Zimbabwe (10.6%, a difference of 0.20%), and Immigrants from Norway (10.6%, a difference of 0.21%).
| Demographics | Rating | Rank | Disability Age 35 to 64 |
| Brazilians | 96.9 /100 | #111 | Exceptional 10.5% |
| Assyrians/Chaldeans/Syriacs | 96.8 /100 | #112 | Exceptional 10.5% |
| Tongans | 96.6 /100 | #113 | Exceptional 10.5% |
| Immigrants | Morocco | 96.6 /100 | #114 | Exceptional 10.5% |
| Immigrants | Netherlands | 96.3 /100 | #115 | Exceptional 10.5% |
| Immigrants | Nepal | 95.9 /100 | #116 | Exceptional 10.6% |
| Immigrants | South Eastern Asia | 95.7 /100 | #117 | Exceptional 10.6% |
| Immigrants | Moldova | 95.5 /100 | #118 | Exceptional 10.6% |
| Luxembourgers | 95.5 /100 | #119 | Exceptional 10.6% |
| Vietnamese | 95.4 /100 | #120 | Exceptional 10.6% |
| Romanians | 95.0 /100 | #121 | Exceptional 10.6% |
| Immigrants | Norway | 95.0 /100 | #122 | Exceptional 10.6% |
| Maltese | 94.8 /100 | #123 | Exceptional 10.6% |
| Estonians | 94.5 /100 | #124 | Exceptional 10.6% |
| Albanians | 94.2 /100 | #125 | Exceptional 10.6% |
| Immigrants | Afghanistan | 94.1 /100 | #126 | Exceptional 10.6% |
| Immigrants | Zimbabwe | 94.0 /100 | #127 | Exceptional 10.6% |
| South Africans | 93.3 /100 | #128 | Exceptional 10.7% |
| Ecuadorians | 93.1 /100 | #129 | Exceptional 10.7% |
| Immigrants | Syria | 93.0 /100 | #130 | Exceptional 10.7% |
| Immigrants | El Salvador | 92.8 /100 | #131 | Exceptional 10.7% |