Carpatho Rusyn vs Estonian Disability Age 35 to 64
COMPARE
Carpatho Rusyn
Estonian
Disability Age 35 to 64
Disability Age 35 to 64 Comparison
Carpatho Rusyns
Estonians
11.5%
DISABILITY AGE 35 TO 64
25.3/ 100
METRIC RATING
195th/ 347
METRIC RANK
10.6%
DISABILITY AGE 35 TO 64
94.5/ 100
METRIC RATING
124th/ 347
METRIC RANK
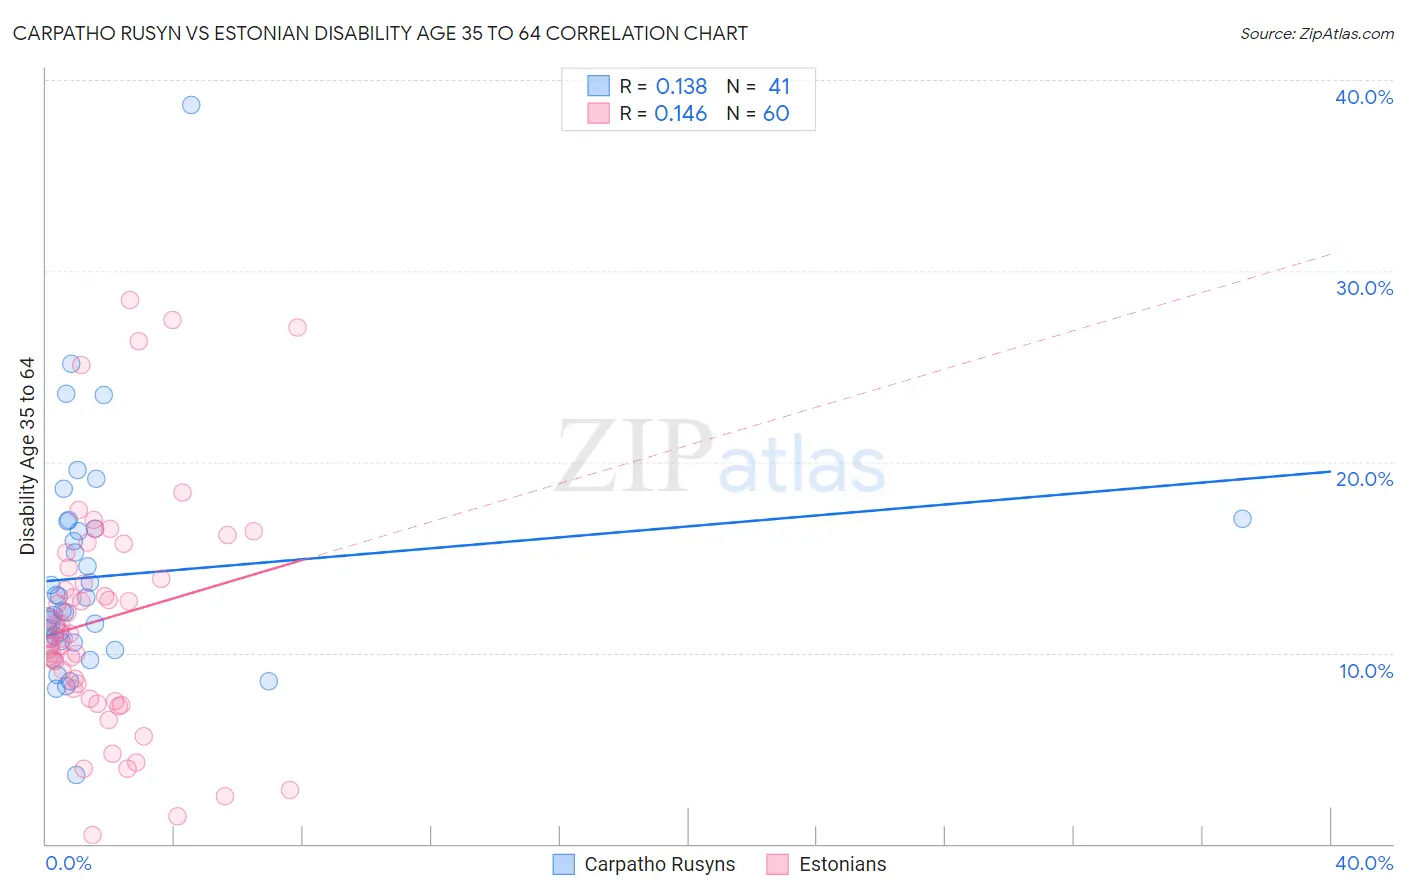
Carpatho Rusyn vs Estonian Disability Age 35 to 64 Correlation Chart
The statistical analysis conducted on geographies consisting of 58,871,605 people shows a poor positive correlation between the proportion of Carpatho Rusyns and percentage of population with a disability between the ages 34 and 64 in the United States with a correlation coefficient (R) of 0.138 and weighted average of 11.5%. Similarly, the statistical analysis conducted on geographies consisting of 123,493,933 people shows a poor positive correlation between the proportion of Estonians and percentage of population with a disability between the ages 34 and 64 in the United States with a correlation coefficient (R) of 0.146 and weighted average of 10.6%, a difference of 8.4%.
Disability Age 35 to 64 Correlation Summary
| Measurement | Carpatho Rusyn | Estonian |
| Minimum | 3.6% | 0.48% |
| Maximum | 38.7% | 28.4% |
| Range | 35.0% | 28.0% |
| Mean | 14.0% | 11.8% |
| Median | 12.2% | 11.1% |
| Interquartile 25% (IQ1) | 10.6% | 7.9% |
| Interquartile 75% (IQ3) | 16.7% | 14.9% |
| Interquartile Range (IQR) | 6.1% | 7.0% |
| Standard Deviation (Sample) | 6.0% | 6.2% |
| Standard Deviation (Population) | 5.9% | 6.1% |
Similar Demographics by Disability Age 35 to 64
Demographics Similar to Carpatho Rusyns by Disability Age 35 to 64
In terms of disability age 35 to 64, the demographic groups most similar to Carpatho Rusyns are Iraqi (11.5%, a difference of 0.12%), Immigrants from Latin America (11.5%, a difference of 0.22%), Immigrants from Africa (11.5%, a difference of 0.37%), Norwegian (11.5%, a difference of 0.43%), and Immigrants from Iraq (11.6%, a difference of 0.48%).
| Demographics | Rating | Rank | Disability Age 35 to 64 |
| Northern Europeans | 34.9 /100 | #188 | Fair 11.4% |
| Hungarians | 34.6 /100 | #189 | Fair 11.4% |
| Immigrants | Nigeria | 32.5 /100 | #190 | Fair 11.4% |
| Swedes | 31.3 /100 | #191 | Fair 11.4% |
| Norwegians | 29.7 /100 | #192 | Fair 11.5% |
| Immigrants | Africa | 29.0 /100 | #193 | Fair 11.5% |
| Immigrants | Latin America | 27.5 /100 | #194 | Fair 11.5% |
| Carpatho Rusyns | 25.3 /100 | #195 | Fair 11.5% |
| Iraqis | 24.2 /100 | #196 | Fair 11.5% |
| Immigrants | Iraq | 21.0 /100 | #197 | Fair 11.6% |
| Immigrants | Panama | 20.4 /100 | #198 | Fair 11.6% |
| Basques | 19.5 /100 | #199 | Poor 11.6% |
| Swiss | 18.7 /100 | #200 | Poor 11.6% |
| Immigrants | Kenya | 17.7 /100 | #201 | Poor 11.6% |
| Immigrants | Guatemala | 17.5 /100 | #202 | Poor 11.6% |
Demographics Similar to Estonians by Disability Age 35 to 64
In terms of disability age 35 to 64, the demographic groups most similar to Estonians are Albanian (10.6%, a difference of 0.10%), Maltese (10.6%, a difference of 0.12%), Immigrants from Afghanistan (10.6%, a difference of 0.16%), Immigrants from Zimbabwe (10.6%, a difference of 0.20%), and Immigrants from Norway (10.6%, a difference of 0.21%).
| Demographics | Rating | Rank | Disability Age 35 to 64 |
| Immigrants | South Eastern Asia | 95.7 /100 | #117 | Exceptional 10.6% |
| Immigrants | Moldova | 95.5 /100 | #118 | Exceptional 10.6% |
| Luxembourgers | 95.5 /100 | #119 | Exceptional 10.6% |
| Vietnamese | 95.4 /100 | #120 | Exceptional 10.6% |
| Romanians | 95.0 /100 | #121 | Exceptional 10.6% |
| Immigrants | Norway | 95.0 /100 | #122 | Exceptional 10.6% |
| Maltese | 94.8 /100 | #123 | Exceptional 10.6% |
| Estonians | 94.5 /100 | #124 | Exceptional 10.6% |
| Albanians | 94.2 /100 | #125 | Exceptional 10.6% |
| Immigrants | Afghanistan | 94.1 /100 | #126 | Exceptional 10.6% |
| Immigrants | Zimbabwe | 94.0 /100 | #127 | Exceptional 10.6% |
| South Africans | 93.3 /100 | #128 | Exceptional 10.7% |
| Ecuadorians | 93.1 /100 | #129 | Exceptional 10.7% |
| Immigrants | Syria | 93.0 /100 | #130 | Exceptional 10.7% |
| Immigrants | El Salvador | 92.8 /100 | #131 | Exceptional 10.7% |