Costa Rican vs Brazilian Disability Age 35 to 64
COMPARE
Costa Rican
Brazilian
Disability Age 35 to 64
Disability Age 35 to 64 Comparison
Costa Ricans
Brazilians
10.7%
DISABILITY AGE 35 TO 64
91.4/ 100
METRIC RATING
139th/ 347
METRIC RANK
10.5%
DISABILITY AGE 35 TO 64
96.9/ 100
METRIC RATING
111th/ 347
METRIC RANK
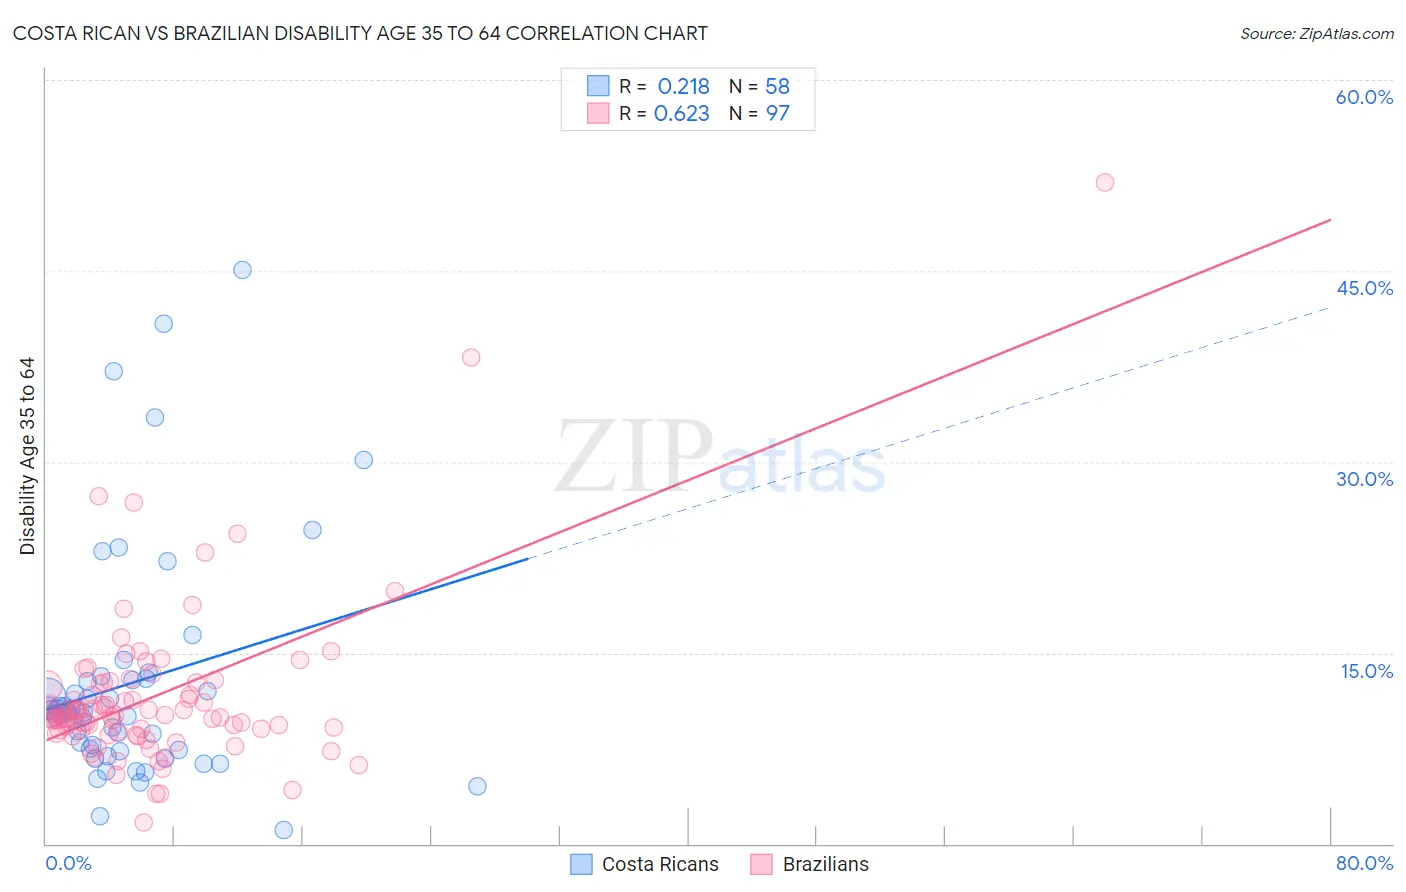
Costa Rican vs Brazilian Disability Age 35 to 64 Correlation Chart
The statistical analysis conducted on geographies consisting of 253,472,399 people shows a weak positive correlation between the proportion of Costa Ricans and percentage of population with a disability between the ages 34 and 64 in the United States with a correlation coefficient (R) of 0.218 and weighted average of 10.7%. Similarly, the statistical analysis conducted on geographies consisting of 323,696,465 people shows a significant positive correlation between the proportion of Brazilians and percentage of population with a disability between the ages 34 and 64 in the United States with a correlation coefficient (R) of 0.623 and weighted average of 10.5%, a difference of 2.3%.
Disability Age 35 to 64 Correlation Summary
| Measurement | Costa Rican | Brazilian |
| Minimum | 1.1% | 1.7% |
| Maximum | 45.1% | 51.9% |
| Range | 44.0% | 50.2% |
| Mean | 12.6% | 11.6% |
| Median | 10.3% | 10.1% |
| Interquartile 25% (IQ1) | 7.4% | 8.8% |
| Interquartile 75% (IQ3) | 12.9% | 12.6% |
| Interquartile Range (IQR) | 5.5% | 3.8% |
| Standard Deviation (Sample) | 9.1% | 6.6% |
| Standard Deviation (Population) | 9.0% | 6.5% |
Similar Demographics by Disability Age 35 to 64
Demographics Similar to Costa Ricans by Disability Age 35 to 64
In terms of disability age 35 to 64, the demographic groups most similar to Costa Ricans are Immigrants from Southern Europe (10.7%, a difference of 0.010%), Immigrants from Scotland (10.7%, a difference of 0.050%), Immigrants from Costa Rica (10.7%, a difference of 0.060%), Salvadoran (10.7%, a difference of 0.13%), and Australian (10.8%, a difference of 0.18%).
| Demographics | Rating | Rank | Disability Age 35 to 64 |
| Immigrants | Albania | 92.5 /100 | #132 | Exceptional 10.7% |
| Immigrants | Immigrants | 92.5 /100 | #133 | Exceptional 10.7% |
| Immigrants | Ecuador | 92.5 /100 | #134 | Exceptional 10.7% |
| Greeks | 92.3 /100 | #135 | Exceptional 10.7% |
| Salvadorans | 91.9 /100 | #136 | Exceptional 10.7% |
| Immigrants | Costa Rica | 91.7 /100 | #137 | Exceptional 10.7% |
| Immigrants | Southern Europe | 91.5 /100 | #138 | Exceptional 10.7% |
| Costa Ricans | 91.4 /100 | #139 | Exceptional 10.7% |
| Immigrants | Scotland | 91.3 /100 | #140 | Exceptional 10.7% |
| Australians | 90.7 /100 | #141 | Exceptional 10.8% |
| Immigrants | Saudi Arabia | 90.6 /100 | #142 | Exceptional 10.8% |
| Sierra Leoneans | 89.7 /100 | #143 | Excellent 10.8% |
| Lithuanians | 88.7 /100 | #144 | Excellent 10.8% |
| Immigrants | Bangladesh | 85.6 /100 | #145 | Excellent 10.9% |
| South American Indians | 83.5 /100 | #146 | Excellent 10.9% |
Demographics Similar to Brazilians by Disability Age 35 to 64
In terms of disability age 35 to 64, the demographic groups most similar to Brazilians are Assyrian/Chaldean/Syriac (10.5%, a difference of 0.030%), Tongan (10.5%, a difference of 0.15%), Korean (10.5%, a difference of 0.20%), Immigrants from Morocco (10.5%, a difference of 0.20%), and Immigrants from Ethiopia (10.5%, a difference of 0.27%).
| Demographics | Rating | Rank | Disability Age 35 to 64 |
| Immigrants | Austria | 97.8 /100 | #104 | Exceptional 10.4% |
| Macedonians | 97.8 /100 | #105 | Exceptional 10.4% |
| Immigrants | Hungary | 97.6 /100 | #106 | Exceptional 10.4% |
| Zimbabweans | 97.4 /100 | #107 | Exceptional 10.4% |
| Ethiopians | 97.4 /100 | #108 | Exceptional 10.5% |
| Immigrants | Ethiopia | 97.2 /100 | #109 | Exceptional 10.5% |
| Koreans | 97.1 /100 | #110 | Exceptional 10.5% |
| Brazilians | 96.9 /100 | #111 | Exceptional 10.5% |
| Assyrians/Chaldeans/Syriacs | 96.8 /100 | #112 | Exceptional 10.5% |
| Tongans | 96.6 /100 | #113 | Exceptional 10.5% |
| Immigrants | Morocco | 96.6 /100 | #114 | Exceptional 10.5% |
| Immigrants | Netherlands | 96.3 /100 | #115 | Exceptional 10.5% |
| Immigrants | Nepal | 95.9 /100 | #116 | Exceptional 10.6% |
| Immigrants | South Eastern Asia | 95.7 /100 | #117 | Exceptional 10.6% |
| Immigrants | Moldova | 95.5 /100 | #118 | Exceptional 10.6% |