Comanche vs Immigrants from Northern Europe Vision Disability
COMPARE
Comanche
Immigrants from Northern Europe
Vision Disability
Vision Disability Comparison
Comanche
Immigrants from Northern Europe
2.8%
VISION DISABILITY
0.0/ 100
METRIC RATING
321st/ 347
METRIC RANK
2.0%
VISION DISABILITY
98.6/ 100
METRIC RATING
71st/ 347
METRIC RANK
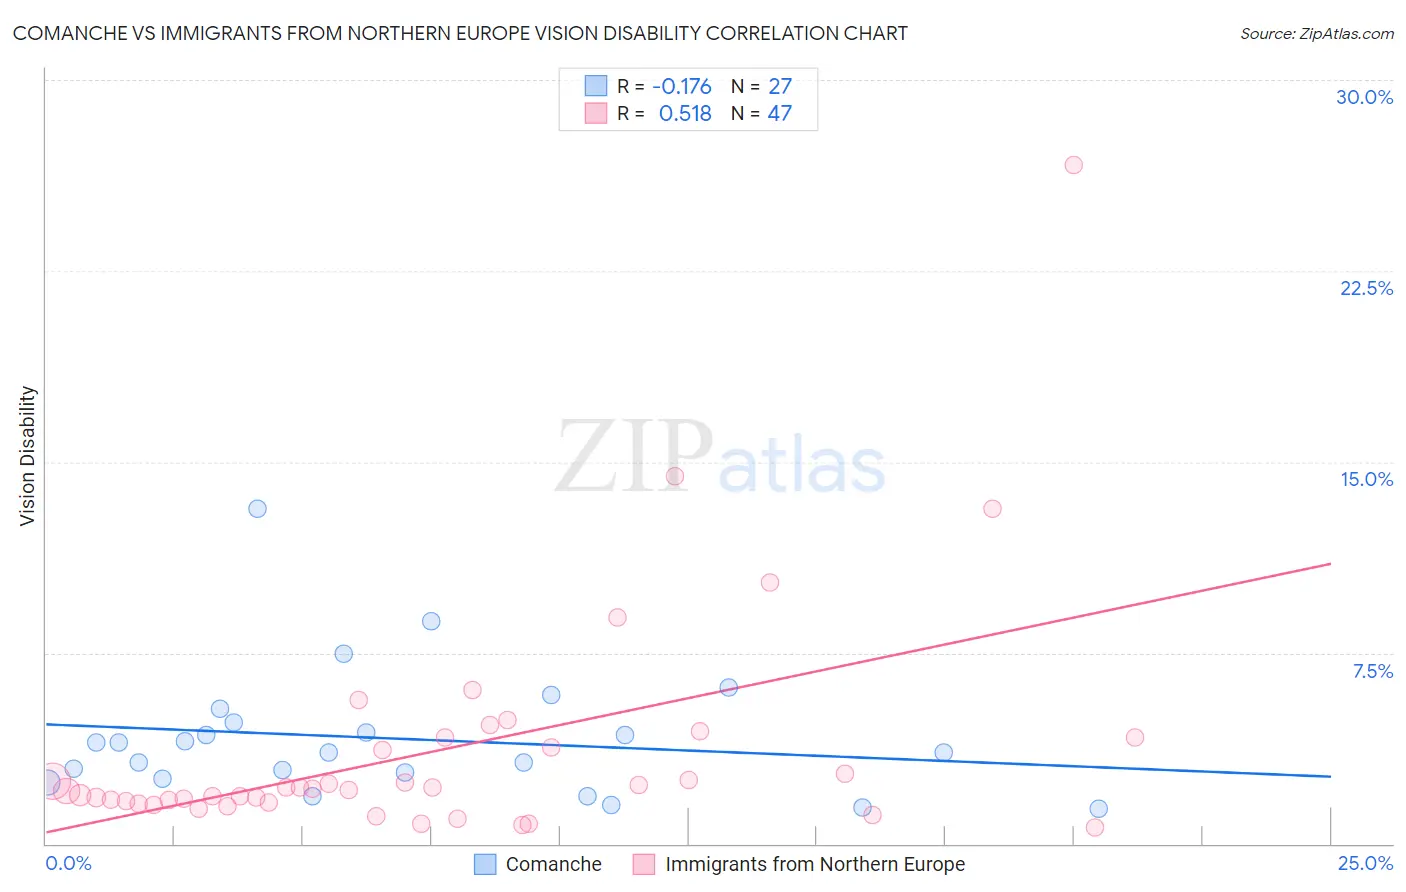
Comanche vs Immigrants from Northern Europe Vision Disability Correlation Chart
The statistical analysis conducted on geographies consisting of 109,767,498 people shows a poor negative correlation between the proportion of Comanche and percentage of population with vision disability in the United States with a correlation coefficient (R) of -0.176 and weighted average of 2.8%. Similarly, the statistical analysis conducted on geographies consisting of 476,530,076 people shows a substantial positive correlation between the proportion of Immigrants from Northern Europe and percentage of population with vision disability in the United States with a correlation coefficient (R) of 0.518 and weighted average of 2.0%, a difference of 40.6%.
Vision Disability Correlation Summary
| Measurement | Comanche | Immigrants from Northern Europe |
| Minimum | 1.4% | 0.66% |
| Maximum | 13.1% | 26.7% |
| Range | 11.8% | 26.0% |
| Mean | 4.1% | 3.7% |
| Median | 3.6% | 2.2% |
| Interquartile 25% (IQ1) | 2.6% | 1.6% |
| Interquartile 75% (IQ3) | 4.8% | 4.2% |
| Interquartile Range (IQR) | 2.2% | 2.5% |
| Standard Deviation (Sample) | 2.5% | 4.5% |
| Standard Deviation (Population) | 2.5% | 4.5% |
Similar Demographics by Vision Disability
Demographics Similar to Comanche by Vision Disability
In terms of vision disability, the demographic groups most similar to Comanche are Paiute (2.9%, a difference of 0.42%), Tlingit-Haida (2.9%, a difference of 0.42%), Black/African American (2.8%, a difference of 2.0%), Hopi (2.9%, a difference of 2.4%), and Cherokee (2.9%, a difference of 2.4%).
| Demographics | Rating | Rank | Vision Disability |
| Inupiat | 0.0 /100 | #314 | Tragic 2.7% |
| Osage | 0.0 /100 | #315 | Tragic 2.7% |
| Shoshone | 0.0 /100 | #316 | Tragic 2.7% |
| Yup'ik | 0.0 /100 | #317 | Tragic 2.7% |
| Alaska Natives | 0.0 /100 | #318 | Tragic 2.7% |
| Tohono O'odham | 0.0 /100 | #319 | Tragic 2.8% |
| Blacks/African Americans | 0.0 /100 | #320 | Tragic 2.8% |
| Comanche | 0.0 /100 | #321 | Tragic 2.8% |
| Paiute | 0.0 /100 | #322 | Tragic 2.9% |
| Tlingit-Haida | 0.0 /100 | #323 | Tragic 2.9% |
| Hopi | 0.0 /100 | #324 | Tragic 2.9% |
| Cherokee | 0.0 /100 | #325 | Tragic 2.9% |
| Spanish Americans | 0.0 /100 | #326 | Tragic 2.9% |
| Natives/Alaskans | 0.0 /100 | #327 | Tragic 3.0% |
| Yuman | 0.0 /100 | #328 | Tragic 3.0% |
Demographics Similar to Immigrants from Northern Europe by Vision Disability
In terms of vision disability, the demographic groups most similar to Immigrants from Northern Europe are Immigrants from Kazakhstan (2.0%, a difference of 0.010%), Russian (2.0%, a difference of 0.030%), Immigrants from France (2.0%, a difference of 0.050%), Immigrants from Czechoslovakia (2.0%, a difference of 0.20%), and Immigrants from Eritrea (2.0%, a difference of 0.25%).
| Demographics | Rating | Rank | Vision Disability |
| Immigrants | Greece | 99.0 /100 | #64 | Exceptional 2.0% |
| Maltese | 98.9 /100 | #65 | Exceptional 2.0% |
| Immigrants | Argentina | 98.9 /100 | #66 | Exceptional 2.0% |
| Immigrants | Northern Africa | 98.8 /100 | #67 | Exceptional 2.0% |
| Immigrants | Czechoslovakia | 98.7 /100 | #68 | Exceptional 2.0% |
| Russians | 98.6 /100 | #69 | Exceptional 2.0% |
| Immigrants | Kazakhstan | 98.6 /100 | #70 | Exceptional 2.0% |
| Immigrants | Northern Europe | 98.6 /100 | #71 | Exceptional 2.0% |
| Immigrants | France | 98.5 /100 | #72 | Exceptional 2.0% |
| Immigrants | Eritrea | 98.4 /100 | #73 | Exceptional 2.0% |
| Palestinians | 98.3 /100 | #74 | Exceptional 2.0% |
| Immigrants | North Macedonia | 98.3 /100 | #75 | Exceptional 2.0% |
| Paraguayans | 98.3 /100 | #76 | Exceptional 2.0% |
| Immigrants | Jordan | 98.3 /100 | #77 | Exceptional 2.0% |
| Immigrants | Eastern Europe | 98.3 /100 | #78 | Exceptional 2.0% |