Colville vs Afghan Disability Age Over 75
COMPARE
Colville
Afghan
Disability Age Over 75
Disability Age Over 75 Comparison
Colville
Afghans
55.4%
DISABILITY AGE OVER 75
0.0/ 100
METRIC RATING
338th/ 347
METRIC RANK
48.4%
DISABILITY AGE OVER 75
1.8/ 100
METRIC RATING
244th/ 347
METRIC RANK
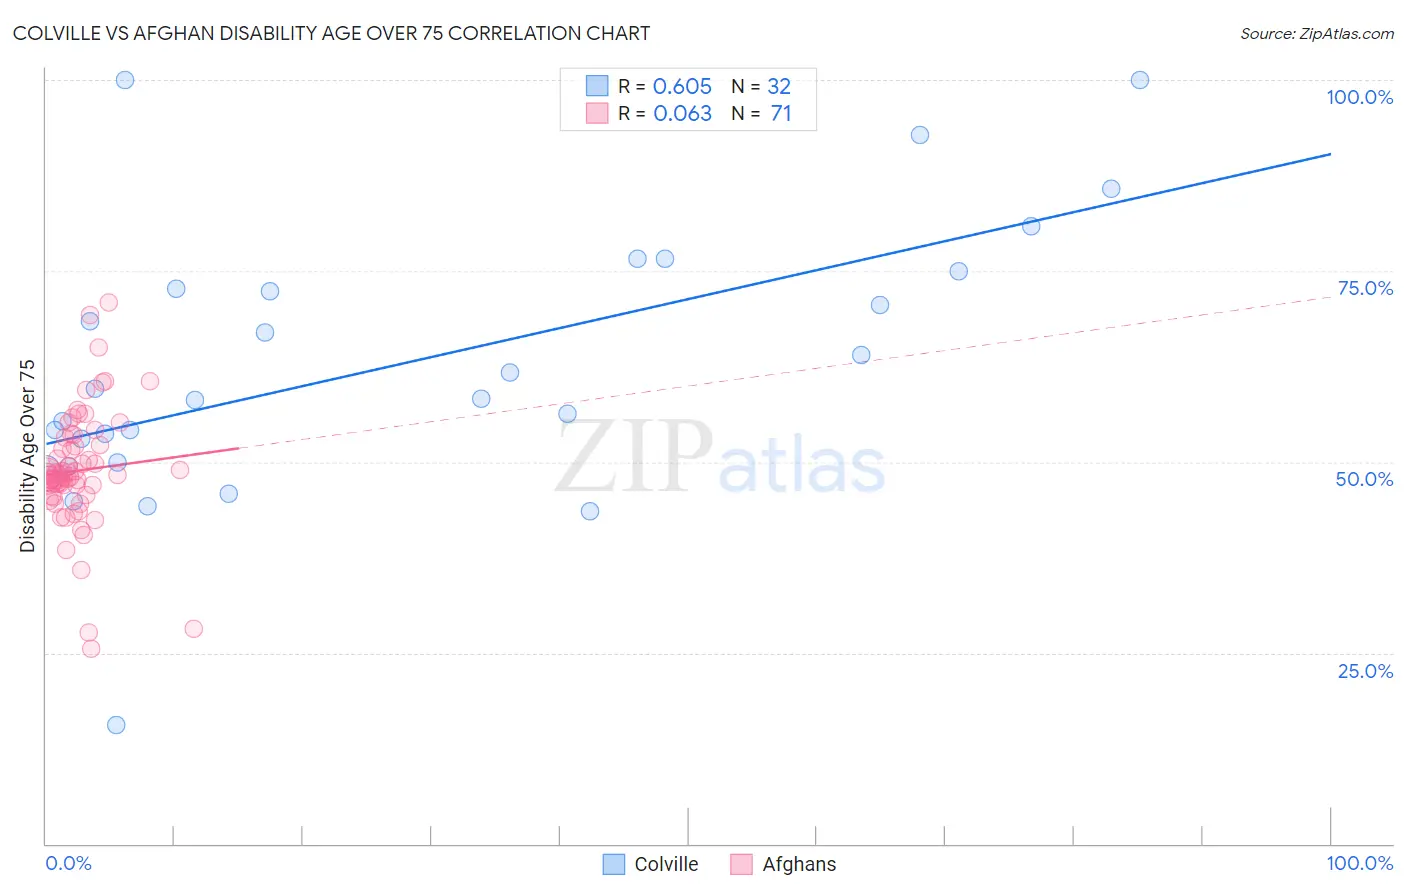
Colville vs Afghan Disability Age Over 75 Correlation Chart
The statistical analysis conducted on geographies consisting of 34,670,841 people shows a significant positive correlation between the proportion of Colville and percentage of population with a disability over the age of 75 in the United States with a correlation coefficient (R) of 0.605 and weighted average of 55.4%. Similarly, the statistical analysis conducted on geographies consisting of 148,746,614 people shows a slight positive correlation between the proportion of Afghans and percentage of population with a disability over the age of 75 in the United States with a correlation coefficient (R) of 0.063 and weighted average of 48.4%, a difference of 14.4%.
Disability Age Over 75 Correlation Summary
| Measurement | Colville | Afghan |
| Minimum | 15.6% | 25.5% |
| Maximum | 100.0% | 70.8% |
| Range | 84.4% | 45.3% |
| Mean | 62.8% | 48.9% |
| Median | 58.9% | 48.1% |
| Interquartile 25% (IQ1) | 51.5% | 45.6% |
| Interquartile 75% (IQ3) | 73.8% | 52.3% |
| Interquartile Range (IQR) | 22.3% | 6.6% |
| Standard Deviation (Sample) | 17.9% | 7.8% |
| Standard Deviation (Population) | 17.6% | 7.7% |
Similar Demographics by Disability Age Over 75
Demographics Similar to Colville by Disability Age Over 75
In terms of disability age over 75, the demographic groups most similar to Colville are Pima (55.8%, a difference of 0.82%), Pueblo (55.9%, a difference of 0.90%), Houma (56.2%, a difference of 1.4%), Lumbee (56.2%, a difference of 1.6%), and Yuman (54.4%, a difference of 1.8%).
| Demographics | Rating | Rank | Disability Age Over 75 |
| Hopi | 0.0 /100 | #331 | Tragic 52.9% |
| Natives/Alaskans | 0.0 /100 | #332 | Tragic 53.1% |
| Apache | 0.0 /100 | #333 | Tragic 53.6% |
| Alaskan Athabascans | 0.0 /100 | #334 | Tragic 54.0% |
| Kiowa | 0.0 /100 | #335 | Tragic 54.2% |
| Immigrants | Armenia | 0.0 /100 | #336 | Tragic 54.3% |
| Yuman | 0.0 /100 | #337 | Tragic 54.4% |
| Colville | 0.0 /100 | #338 | Tragic 55.4% |
| Pima | 0.0 /100 | #339 | Tragic 55.8% |
| Pueblo | 0.0 /100 | #340 | Tragic 55.9% |
| Houma | 0.0 /100 | #341 | Tragic 56.2% |
| Lumbee | 0.0 /100 | #342 | Tragic 56.2% |
| Tohono O'odham | 0.0 /100 | #343 | Tragic 56.7% |
| Navajo | 0.0 /100 | #344 | Tragic 58.3% |
| Inupiat | 0.0 /100 | #345 | Tragic 58.4% |
Demographics Similar to Afghans by Disability Age Over 75
In terms of disability age over 75, the demographic groups most similar to Afghans are American (48.4%, a difference of 0.020%), Chippewa (48.4%, a difference of 0.060%), Iroquois (48.4%, a difference of 0.070%), Immigrants from Caribbean (48.4%, a difference of 0.090%), and Native Hawaiian (48.3%, a difference of 0.13%).
| Demographics | Rating | Rank | Disability Age Over 75 |
| Immigrants | St. Vincent and the Grenadines | 3.2 /100 | #237 | Tragic 48.2% |
| Nicaraguans | 3.0 /100 | #238 | Tragic 48.3% |
| Immigrants | Thailand | 2.8 /100 | #239 | Tragic 48.3% |
| Tongans | 2.3 /100 | #240 | Tragic 48.3% |
| Native Hawaiians | 2.2 /100 | #241 | Tragic 48.3% |
| French American Indians | 2.2 /100 | #242 | Tragic 48.3% |
| Immigrants | Caribbean | 2.1 /100 | #243 | Tragic 48.4% |
| Afghans | 1.8 /100 | #244 | Tragic 48.4% |
| Americans | 1.7 /100 | #245 | Tragic 48.4% |
| Chippewa | 1.6 /100 | #246 | Tragic 48.4% |
| Iroquois | 1.6 /100 | #247 | Tragic 48.4% |
| Sri Lankans | 1.4 /100 | #248 | Tragic 48.5% |
| Iraqis | 1.0 /100 | #249 | Tragic 48.6% |
| West Indians | 0.8 /100 | #250 | Tragic 48.6% |
| Koreans | 0.8 /100 | #251 | Tragic 48.6% |