Central American vs Afghan Disability Age Over 75
COMPARE
Central American
Afghan
Disability Age Over 75
Disability Age Over 75 Comparison
Central Americans
Afghans
48.8%
DISABILITY AGE OVER 75
0.4/ 100
METRIC RATING
259th/ 347
METRIC RANK
48.4%
DISABILITY AGE OVER 75
1.8/ 100
METRIC RATING
244th/ 347
METRIC RANK
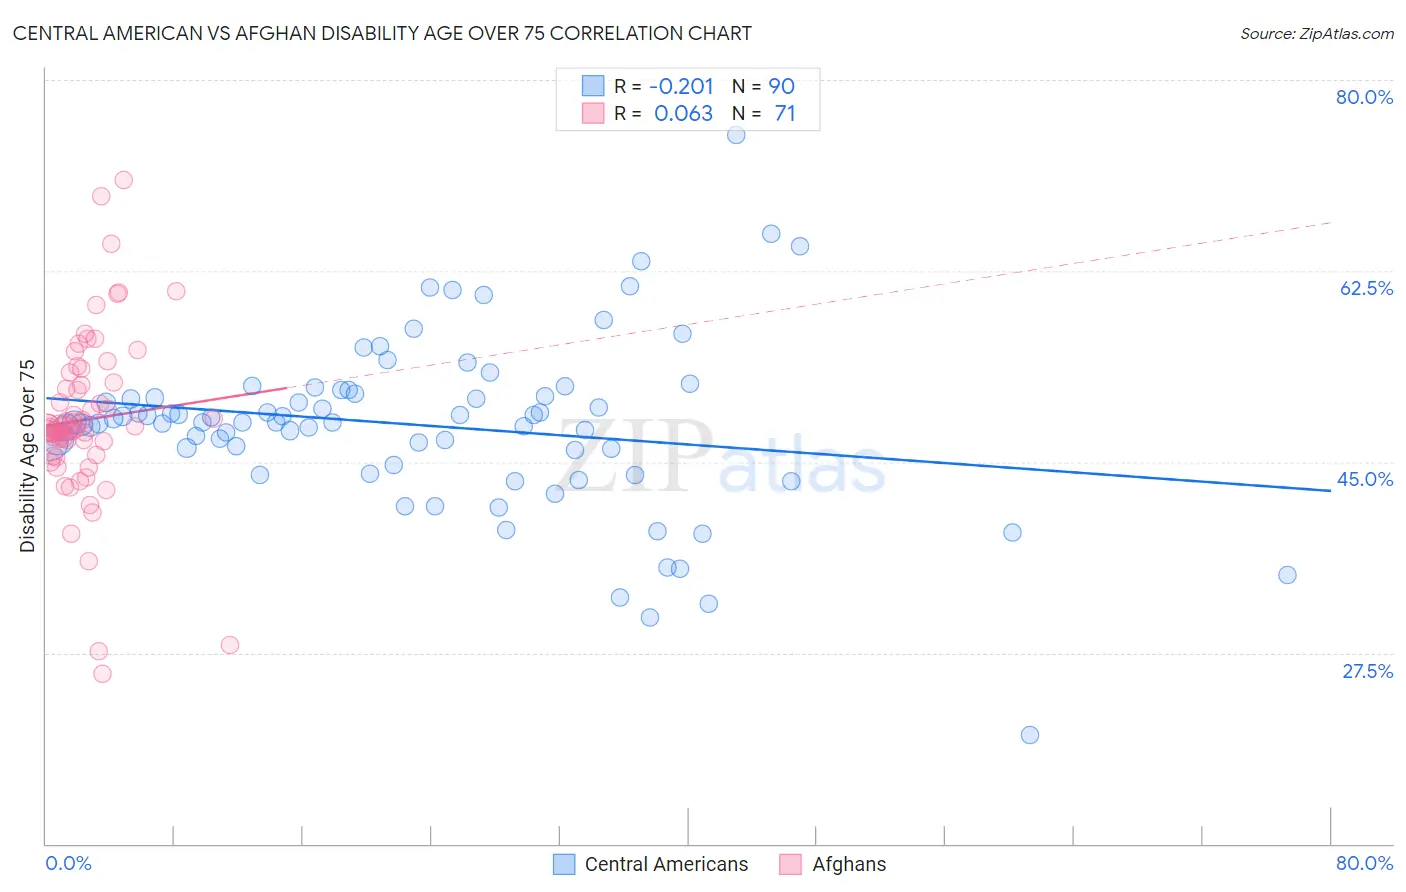
Central American vs Afghan Disability Age Over 75 Correlation Chart
The statistical analysis conducted on geographies consisting of 503,152,130 people shows a weak negative correlation between the proportion of Central Americans and percentage of population with a disability over the age of 75 in the United States with a correlation coefficient (R) of -0.201 and weighted average of 48.8%. Similarly, the statistical analysis conducted on geographies consisting of 148,746,614 people shows a slight positive correlation between the proportion of Afghans and percentage of population with a disability over the age of 75 in the United States with a correlation coefficient (R) of 0.063 and weighted average of 48.4%, a difference of 0.84%.
Disability Age Over 75 Correlation Summary
| Measurement | Central American | Afghan |
| Minimum | 20.0% | 25.5% |
| Maximum | 75.0% | 70.8% |
| Range | 55.0% | 45.3% |
| Mean | 48.4% | 48.9% |
| Median | 48.6% | 48.1% |
| Interquartile 25% (IQ1) | 46.1% | 45.6% |
| Interquartile 75% (IQ3) | 51.3% | 52.3% |
| Interquartile Range (IQR) | 5.1% | 6.6% |
| Standard Deviation (Sample) | 8.0% | 7.8% |
| Standard Deviation (Population) | 7.9% | 7.7% |
Demographics Similar to Central Americans and Afghans by Disability Age Over 75
In terms of disability age over 75, the demographic groups most similar to Central Americans are Immigrants from Afghanistan (48.8%, a difference of 0.040%), Immigrants from Philippines (48.8%, a difference of 0.070%), African (48.9%, a difference of 0.10%), Blackfeet (48.8%, a difference of 0.11%), and Immigrants from Congo (48.7%, a difference of 0.17%). Similarly, the demographic groups most similar to Afghans are American (48.4%, a difference of 0.020%), Chippewa (48.4%, a difference of 0.060%), Iroquois (48.4%, a difference of 0.070%), Immigrants from Caribbean (48.4%, a difference of 0.090%), and Native Hawaiian (48.3%, a difference of 0.13%).
| Demographics | Rating | Rank | Disability Age Over 75 |
| Native Hawaiians | 2.2 /100 | #241 | Tragic 48.3% |
| French American Indians | 2.2 /100 | #242 | Tragic 48.3% |
| Immigrants | Caribbean | 2.1 /100 | #243 | Tragic 48.4% |
| Afghans | 1.8 /100 | #244 | Tragic 48.4% |
| Americans | 1.7 /100 | #245 | Tragic 48.4% |
| Chippewa | 1.6 /100 | #246 | Tragic 48.4% |
| Iroquois | 1.6 /100 | #247 | Tragic 48.4% |
| Sri Lankans | 1.4 /100 | #248 | Tragic 48.5% |
| Iraqis | 1.0 /100 | #249 | Tragic 48.6% |
| West Indians | 0.8 /100 | #250 | Tragic 48.6% |
| Koreans | 0.8 /100 | #251 | Tragic 48.6% |
| Immigrants | South Eastern Asia | 0.7 /100 | #252 | Tragic 48.7% |
| British West Indians | 0.6 /100 | #253 | Tragic 48.7% |
| Immigrants | Vietnam | 0.6 /100 | #254 | Tragic 48.7% |
| Chinese | 0.5 /100 | #255 | Tragic 48.7% |
| Immigrants | Congo | 0.5 /100 | #256 | Tragic 48.7% |
| Blackfeet | 0.5 /100 | #257 | Tragic 48.8% |
| Immigrants | Philippines | 0.4 /100 | #258 | Tragic 48.8% |
| Central Americans | 0.4 /100 | #259 | Tragic 48.8% |
| Immigrants | Afghanistan | 0.4 /100 | #260 | Tragic 48.8% |
| Africans | 0.3 /100 | #261 | Tragic 48.9% |