Irish vs Afghan Disability Age Over 75
COMPARE
Irish
Afghan
Disability Age Over 75
Disability Age Over 75 Comparison
Irish
Afghans
46.5%
DISABILITY AGE OVER 75
96.0/ 100
METRIC RATING
113th/ 347
METRIC RANK
48.4%
DISABILITY AGE OVER 75
1.8/ 100
METRIC RATING
244th/ 347
METRIC RANK
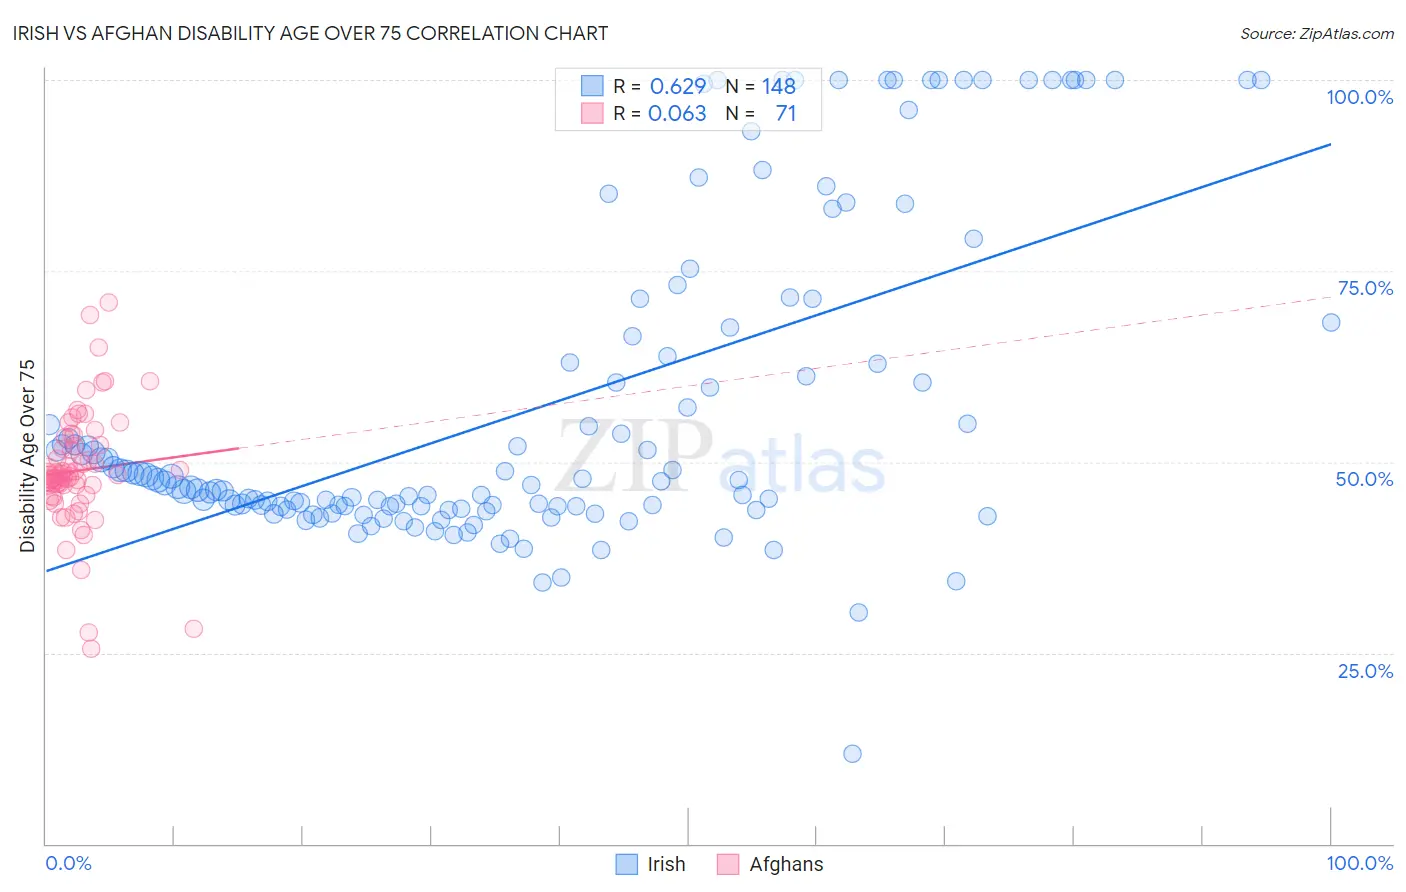
Irish vs Afghan Disability Age Over 75 Correlation Chart
The statistical analysis conducted on geographies consisting of 577,824,255 people shows a significant positive correlation between the proportion of Irish and percentage of population with a disability over the age of 75 in the United States with a correlation coefficient (R) of 0.629 and weighted average of 46.5%. Similarly, the statistical analysis conducted on geographies consisting of 148,746,614 people shows a slight positive correlation between the proportion of Afghans and percentage of population with a disability over the age of 75 in the United States with a correlation coefficient (R) of 0.063 and weighted average of 48.4%, a difference of 4.1%.
Disability Age Over 75 Correlation Summary
| Measurement | Irish | Afghan |
| Minimum | 11.8% | 25.5% |
| Maximum | 100.0% | 70.8% |
| Range | 88.2% | 45.3% |
| Mean | 57.0% | 48.9% |
| Median | 47.4% | 48.1% |
| Interquartile 25% (IQ1) | 44.1% | 45.6% |
| Interquartile 75% (IQ3) | 65.1% | 52.3% |
| Interquartile Range (IQR) | 21.0% | 6.6% |
| Standard Deviation (Sample) | 20.9% | 7.8% |
| Standard Deviation (Population) | 20.8% | 7.7% |
Similar Demographics by Disability Age Over 75
Demographics Similar to Irish by Disability Age Over 75
In terms of disability age over 75, the demographic groups most similar to Irish are Dutch (46.5%, a difference of 0.010%), Immigrants from Pakistan (46.5%, a difference of 0.020%), British (46.5%, a difference of 0.040%), Indian (Asian) (46.5%, a difference of 0.040%), and Immigrants from Hong Kong (46.5%, a difference of 0.060%).
| Demographics | Rating | Rank | Disability Age Over 75 |
| Immigrants | Kuwait | 96.8 /100 | #106 | Exceptional 46.4% |
| Immigrants | Uruguay | 96.7 /100 | #107 | Exceptional 46.4% |
| Brazilians | 96.6 /100 | #108 | Exceptional 46.5% |
| Chileans | 96.4 /100 | #109 | Exceptional 46.5% |
| Immigrants | Hong Kong | 96.4 /100 | #110 | Exceptional 46.5% |
| Immigrants | Chile | 96.4 /100 | #111 | Exceptional 46.5% |
| Immigrants | Pakistan | 96.1 /100 | #112 | Exceptional 46.5% |
| Irish | 96.0 /100 | #113 | Exceptional 46.5% |
| Dutch | 95.9 /100 | #114 | Exceptional 46.5% |
| British | 95.7 /100 | #115 | Exceptional 46.5% |
| Indians (Asian) | 95.7 /100 | #116 | Exceptional 46.5% |
| Hungarians | 95.3 /100 | #117 | Exceptional 46.5% |
| Czechoslovakians | 94.7 /100 | #118 | Exceptional 46.6% |
| Canadians | 94.4 /100 | #119 | Exceptional 46.6% |
| Immigrants | Nepal | 94.1 /100 | #120 | Exceptional 46.6% |
Demographics Similar to Afghans by Disability Age Over 75
In terms of disability age over 75, the demographic groups most similar to Afghans are American (48.4%, a difference of 0.020%), Chippewa (48.4%, a difference of 0.060%), Iroquois (48.4%, a difference of 0.070%), Immigrants from Caribbean (48.4%, a difference of 0.090%), and Native Hawaiian (48.3%, a difference of 0.13%).
| Demographics | Rating | Rank | Disability Age Over 75 |
| Immigrants | St. Vincent and the Grenadines | 3.2 /100 | #237 | Tragic 48.2% |
| Nicaraguans | 3.0 /100 | #238 | Tragic 48.3% |
| Immigrants | Thailand | 2.8 /100 | #239 | Tragic 48.3% |
| Tongans | 2.3 /100 | #240 | Tragic 48.3% |
| Native Hawaiians | 2.2 /100 | #241 | Tragic 48.3% |
| French American Indians | 2.2 /100 | #242 | Tragic 48.3% |
| Immigrants | Caribbean | 2.1 /100 | #243 | Tragic 48.4% |
| Afghans | 1.8 /100 | #244 | Tragic 48.4% |
| Americans | 1.7 /100 | #245 | Tragic 48.4% |
| Chippewa | 1.6 /100 | #246 | Tragic 48.4% |
| Iroquois | 1.6 /100 | #247 | Tragic 48.4% |
| Sri Lankans | 1.4 /100 | #248 | Tragic 48.5% |
| Iraqis | 1.0 /100 | #249 | Tragic 48.6% |
| West Indians | 0.8 /100 | #250 | Tragic 48.6% |
| Koreans | 0.8 /100 | #251 | Tragic 48.6% |