Colombian vs Polish Disability Age 65 to 74
COMPARE
Colombian
Polish
Disability Age 65 to 74
Disability Age 65 to 74 Comparison
Colombians
Poles
22.2%
DISABILITY AGE 65 TO 74
96.4/ 100
METRIC RATING
104th/ 347
METRIC RANK
22.0%
DISABILITY AGE 65 TO 74
97.8/ 100
METRIC RATING
92nd/ 347
METRIC RANK
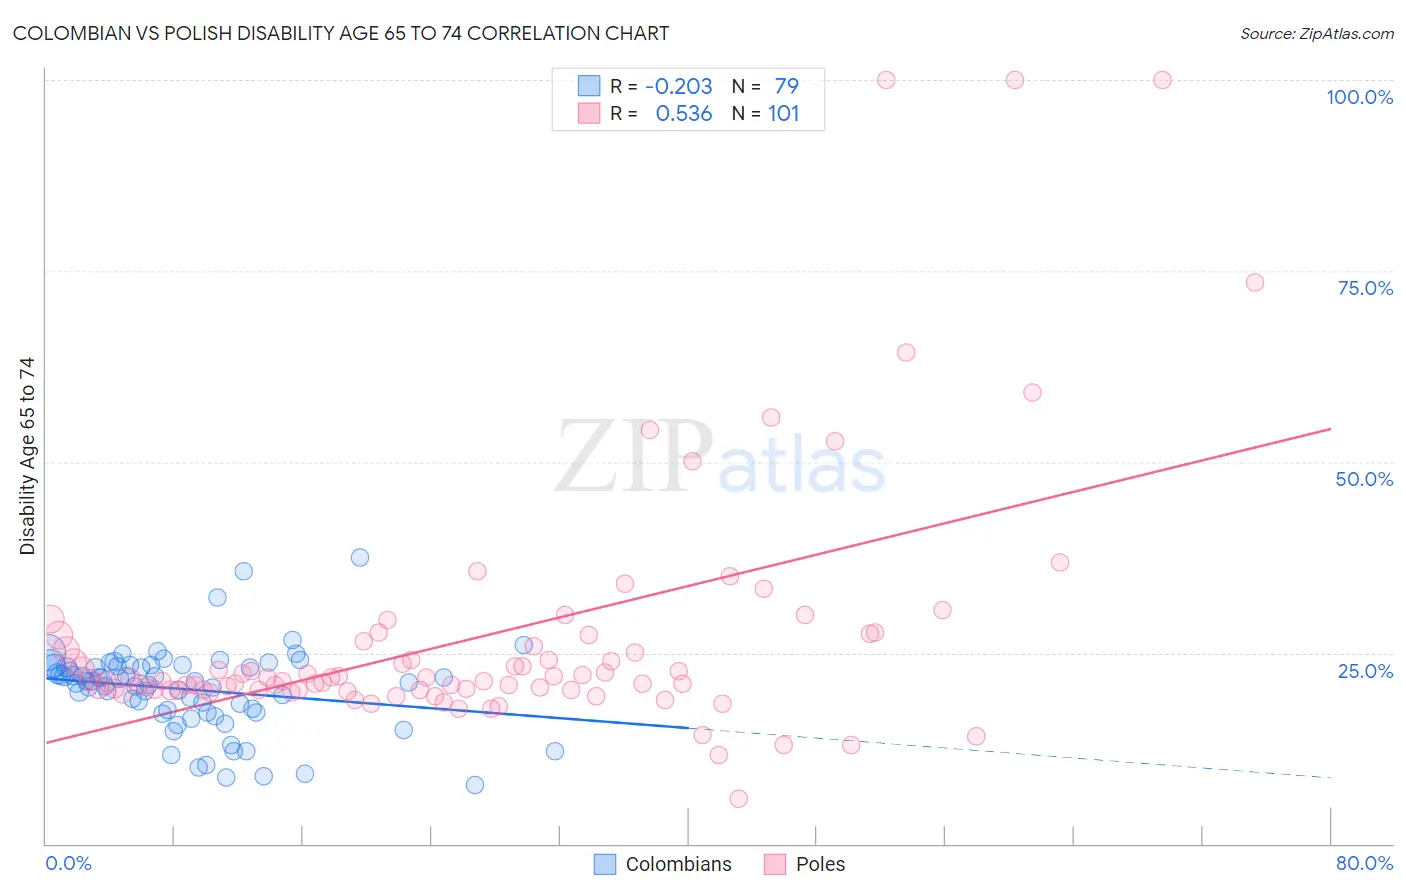
Colombian vs Polish Disability Age 65 to 74 Correlation Chart
The statistical analysis conducted on geographies consisting of 418,615,153 people shows a weak negative correlation between the proportion of Colombians and percentage of population with a disability between the ages 65 and 75 in the United States with a correlation coefficient (R) of -0.203 and weighted average of 22.2%. Similarly, the statistical analysis conducted on geographies consisting of 558,217,001 people shows a substantial positive correlation between the proportion of Poles and percentage of population with a disability between the ages 65 and 75 in the United States with a correlation coefficient (R) of 0.536 and weighted average of 22.0%, a difference of 0.81%.
Disability Age 65 to 74 Correlation Summary
| Measurement | Colombian | Polish |
| Minimum | 7.7% | 5.9% |
| Maximum | 37.5% | 100.0% |
| Range | 29.8% | 94.1% |
| Mean | 20.2% | 27.0% |
| Median | 21.3% | 21.5% |
| Interquartile 25% (IQ1) | 17.2% | 20.2% |
| Interquartile 75% (IQ3) | 23.3% | 26.9% |
| Interquartile Range (IQR) | 6.0% | 6.7% |
| Standard Deviation (Sample) | 5.5% | 16.6% |
| Standard Deviation (Population) | 5.4% | 16.6% |
Demographics Similar to Colombians and Poles by Disability Age 65 to 74
In terms of disability age 65 to 74, the demographic groups most similar to Colombians are South American (22.2%, a difference of 0.010%), Immigrants from Saudi Arabia (22.2%, a difference of 0.030%), Palestinian (22.2%, a difference of 0.040%), Immigrants from England (22.2%, a difference of 0.060%), and Uruguayan (22.2%, a difference of 0.070%). Similarly, the demographic groups most similar to Poles are Immigrants from Canada (22.1%, a difference of 0.030%), Immigrants from Chile (22.1%, a difference of 0.050%), Chilean (22.0%, a difference of 0.060%), Italian (22.0%, a difference of 0.070%), and Immigrants from Kuwait (22.0%, a difference of 0.080%).
| Demographics | Rating | Rank | Disability Age 65 to 74 |
| Immigrants | Netherlands | 97.9 /100 | #88 | Exceptional 22.0% |
| Immigrants | Kuwait | 97.9 /100 | #89 | Exceptional 22.0% |
| Italians | 97.9 /100 | #90 | Exceptional 22.0% |
| Chileans | 97.9 /100 | #91 | Exceptional 22.0% |
| Poles | 97.8 /100 | #92 | Exceptional 22.0% |
| Immigrants | Canada | 97.8 /100 | #93 | Exceptional 22.1% |
| Immigrants | Chile | 97.7 /100 | #94 | Exceptional 22.1% |
| Romanians | 97.7 /100 | #95 | Exceptional 22.1% |
| Immigrants | North America | 97.5 /100 | #96 | Exceptional 22.1% |
| Immigrants | Southern Europe | 97.2 /100 | #97 | Exceptional 22.1% |
| Jordanians | 96.9 /100 | #98 | Exceptional 22.2% |
| Immigrants | Colombia | 96.8 /100 | #99 | Exceptional 22.2% |
| Uruguayans | 96.5 /100 | #100 | Exceptional 22.2% |
| Immigrants | England | 96.5 /100 | #101 | Exceptional 22.2% |
| Immigrants | Saudi Arabia | 96.4 /100 | #102 | Exceptional 22.2% |
| South Americans | 96.4 /100 | #103 | Exceptional 22.2% |
| Colombians | 96.4 /100 | #104 | Exceptional 22.2% |
| Palestinians | 96.3 /100 | #105 | Exceptional 22.2% |
| Peruvians | 96.1 /100 | #106 | Exceptional 22.2% |
| Slovenes | 96.1 /100 | #107 | Exceptional 22.2% |
| Immigrants | Zimbabwe | 96.1 /100 | #108 | Exceptional 22.3% |