Chinese vs Immigrants from Central America Unemployment Among Ages 30 to 34 years
COMPARE
Chinese
Immigrants from Central America
Unemployment Among Ages 30 to 34 years
Unemployment Among Ages 30 to 34 years Comparison
Chinese
Immigrants from Central America
5.1%
UNEMPLOYMENT AMONG AGES 30 TO 34 YEARS
97.7/ 100
METRIC RATING
55th/ 347
METRIC RANK
6.2%
UNEMPLOYMENT AMONG AGES 30 TO 34 YEARS
0.1/ 100
METRIC RATING
262nd/ 347
METRIC RANK
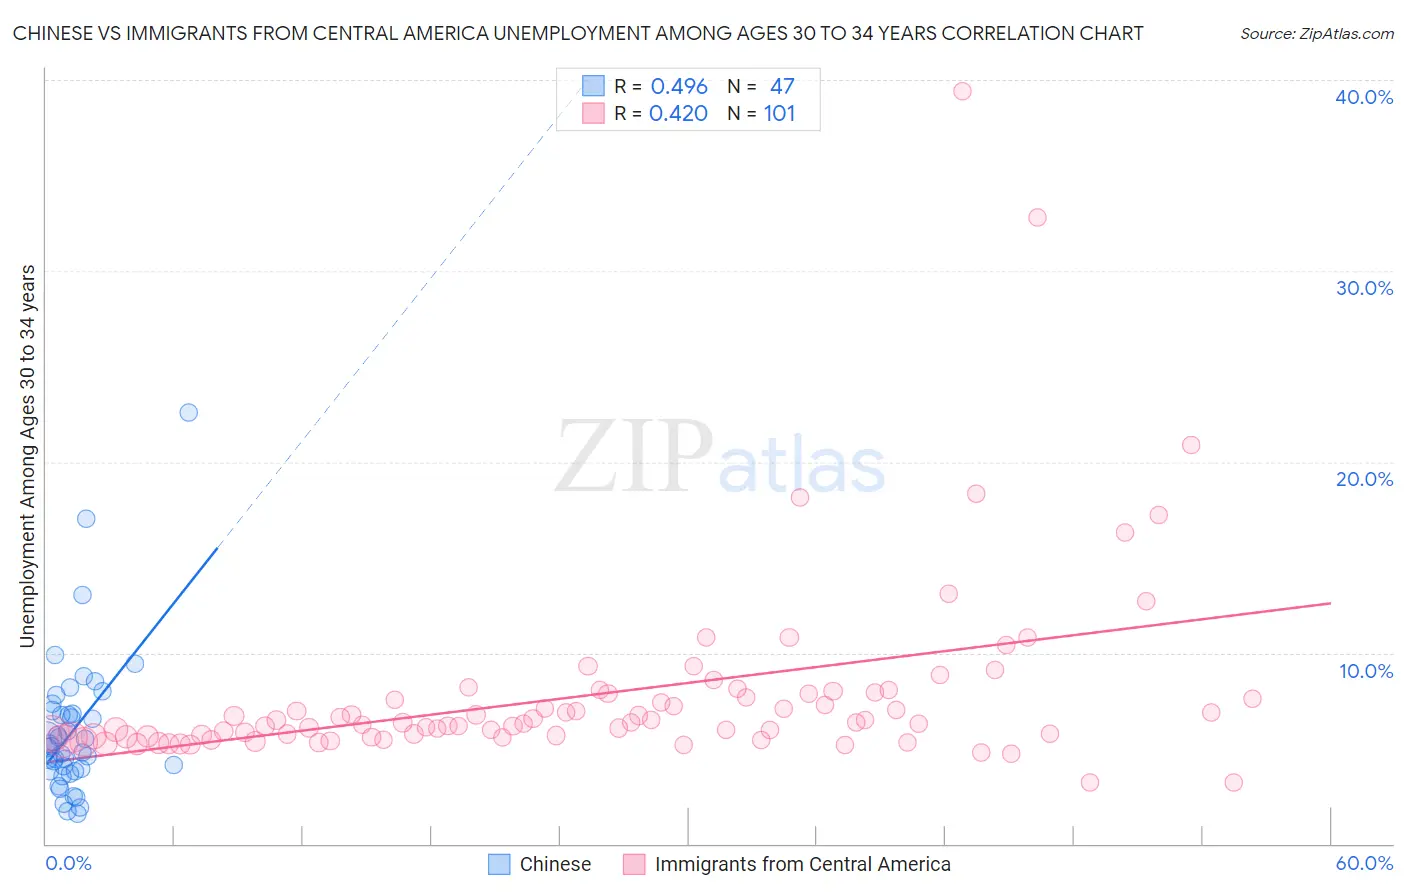
Chinese vs Immigrants from Central America Unemployment Among Ages 30 to 34 years Correlation Chart
The statistical analysis conducted on geographies consisting of 64,021,968 people shows a moderate positive correlation between the proportion of Chinese and unemployment rate among population between the ages 30 and 34 in the United States with a correlation coefficient (R) of 0.496 and weighted average of 5.1%. Similarly, the statistical analysis conducted on geographies consisting of 481,234,417 people shows a moderate positive correlation between the proportion of Immigrants from Central America and unemployment rate among population between the ages 30 and 34 in the United States with a correlation coefficient (R) of 0.420 and weighted average of 6.2%, a difference of 20.8%.
Unemployment Among Ages 30 to 34 years Correlation Summary
| Measurement | Chinese | Immigrants from Central America |
| Minimum | 1.5% | 3.2% |
| Maximum | 22.6% | 39.4% |
| Range | 21.1% | 36.2% |
| Mean | 6.0% | 7.8% |
| Median | 5.1% | 6.3% |
| Interquartile 25% (IQ1) | 3.8% | 5.6% |
| Interquartile 75% (IQ3) | 7.0% | 7.9% |
| Interquartile Range (IQR) | 3.2% | 2.3% |
| Standard Deviation (Sample) | 3.8% | 5.1% |
| Standard Deviation (Population) | 3.8% | 5.0% |
Similar Demographics by Unemployment Among Ages 30 to 34 years
Demographics Similar to Chinese by Unemployment Among Ages 30 to 34 years
In terms of unemployment among ages 30 to 34 years, the demographic groups most similar to Chinese are Immigrants from Serbia (5.1%, a difference of 0.19%), Immigrants from Morocco (5.1%, a difference of 0.20%), Immigrants from China (5.1%, a difference of 0.33%), Asian (5.1%, a difference of 0.34%), and Cuban (5.1%, a difference of 0.38%).
| Demographics | Rating | Rank | Unemployment Among Ages 30 to 34 years |
| Assyrians/Chaldeans/Syriacs | 98.4 /100 | #48 | Exceptional 5.1% |
| Immigrants | Malaysia | 98.3 /100 | #49 | Exceptional 5.1% |
| Puget Sound Salish | 98.2 /100 | #50 | Exceptional 5.1% |
| Turks | 98.2 /100 | #51 | Exceptional 5.1% |
| Immigrants | Burma/Myanmar | 98.1 /100 | #52 | Exceptional 5.1% |
| Cubans | 98.1 /100 | #53 | Exceptional 5.1% |
| Immigrants | Morocco | 97.9 /100 | #54 | Exceptional 5.1% |
| Chinese | 97.7 /100 | #55 | Exceptional 5.1% |
| Immigrants | Serbia | 97.4 /100 | #56 | Exceptional 5.1% |
| Immigrants | China | 97.2 /100 | #57 | Exceptional 5.1% |
| Asians | 97.2 /100 | #58 | Exceptional 5.1% |
| Swedes | 97.1 /100 | #59 | Exceptional 5.1% |
| Immigrants | Somalia | 97.1 /100 | #60 | Exceptional 5.1% |
| Indians (Asian) | 97.0 /100 | #61 | Exceptional 5.1% |
| Immigrants | France | 97.0 /100 | #62 | Exceptional 5.1% |
Demographics Similar to Immigrants from Central America by Unemployment Among Ages 30 to 34 years
In terms of unemployment among ages 30 to 34 years, the demographic groups most similar to Immigrants from Central America are Immigrants from Western Africa (6.2%, a difference of 0.18%), Immigrants from Latin America (6.1%, a difference of 0.33%), Spanish American (6.2%, a difference of 0.50%), Chickasaw (6.2%, a difference of 0.54%), and Haitian (6.1%, a difference of 0.55%).
| Demographics | Rating | Rank | Unemployment Among Ages 30 to 34 years |
| Immigrants | Portugal | 0.1 /100 | #255 | Tragic 6.1% |
| Immigrants | Ghana | 0.1 /100 | #256 | Tragic 6.1% |
| Immigrants | Sierra Leone | 0.1 /100 | #257 | Tragic 6.1% |
| Mexicans | 0.1 /100 | #258 | Tragic 6.1% |
| Haitians | 0.1 /100 | #259 | Tragic 6.1% |
| Immigrants | Latin America | 0.1 /100 | #260 | Tragic 6.1% |
| Immigrants | Western Africa | 0.1 /100 | #261 | Tragic 6.2% |
| Immigrants | Central America | 0.1 /100 | #262 | Tragic 6.2% |
| Spanish Americans | 0.0 /100 | #263 | Tragic 6.2% |
| Chickasaw | 0.0 /100 | #264 | Tragic 6.2% |
| Americans | 0.0 /100 | #265 | Tragic 6.2% |
| Seminole | 0.0 /100 | #266 | Tragic 6.2% |
| Immigrants | Mexico | 0.0 /100 | #267 | Tragic 6.2% |
| Immigrants | Haiti | 0.0 /100 | #268 | Tragic 6.2% |
| French American Indians | 0.0 /100 | #269 | Tragic 6.3% |