Chilean vs Guatemalan Disability Age 18 to 34
COMPARE
Chilean
Guatemalan
Disability Age 18 to 34
Disability Age 18 to 34 Comparison
Chileans
Guatemalans
6.3%
DISABILITY AGE 18 TO 34
93.5/ 100
METRIC RATING
119th/ 347
METRIC RANK
6.4%
DISABILITY AGE 18 TO 34
89.6/ 100
METRIC RATING
132nd/ 347
METRIC RANK
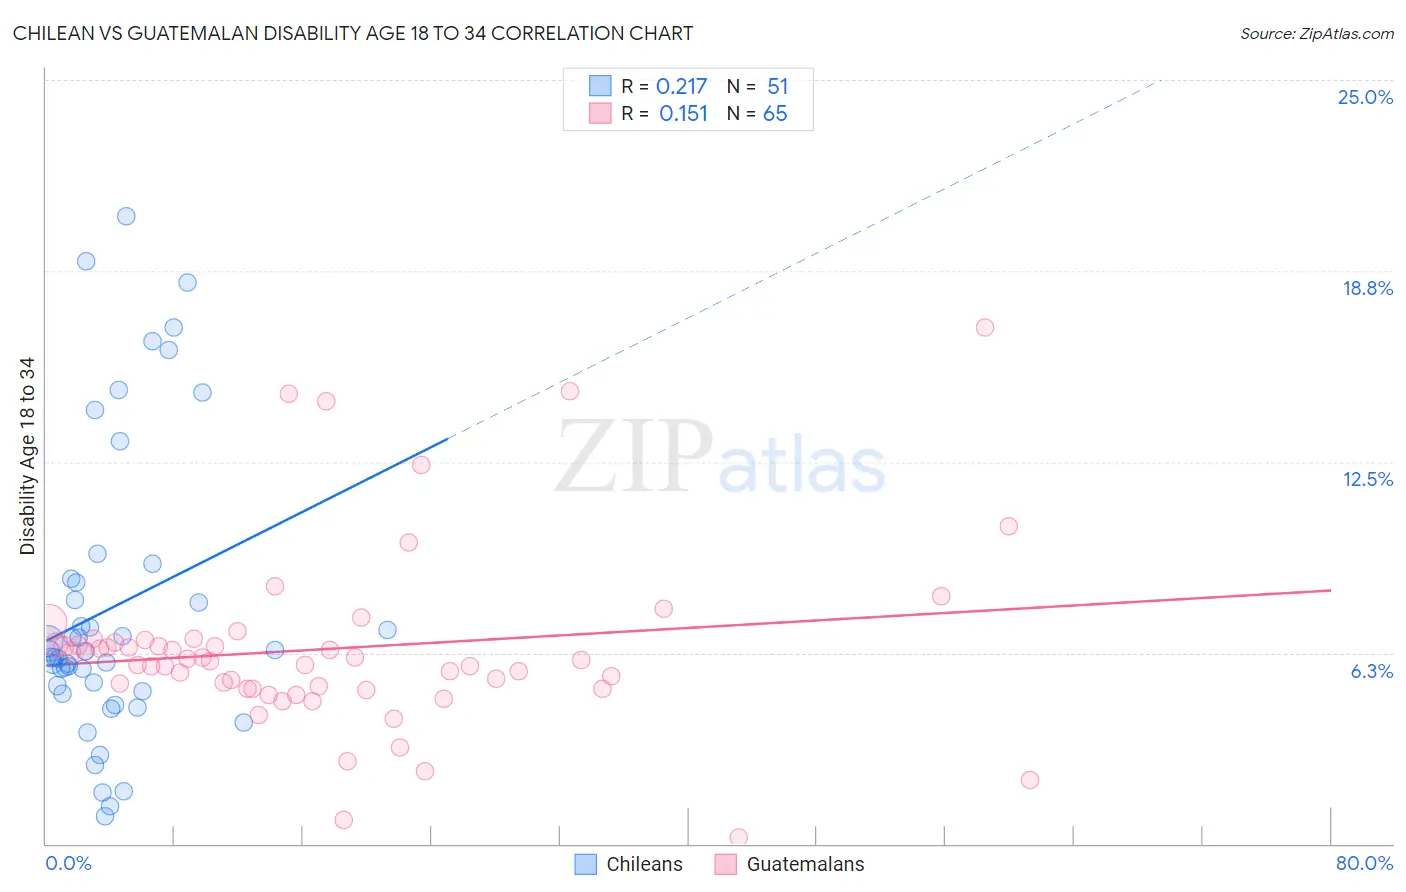
Chilean vs Guatemalan Disability Age 18 to 34 Correlation Chart
The statistical analysis conducted on geographies consisting of 256,471,605 people shows a weak positive correlation between the proportion of Chileans and percentage of population with a disability between the ages 18 and 35 in the United States with a correlation coefficient (R) of 0.217 and weighted average of 6.3%. Similarly, the statistical analysis conducted on geographies consisting of 408,778,912 people shows a poor positive correlation between the proportion of Guatemalans and percentage of population with a disability between the ages 18 and 35 in the United States with a correlation coefficient (R) of 0.151 and weighted average of 6.4%, a difference of 0.92%.
Disability Age 18 to 34 Correlation Summary
| Measurement | Chilean | Guatemalan |
| Minimum | 0.92% | 0.22% |
| Maximum | 20.5% | 16.9% |
| Range | 19.6% | 16.7% |
| Mean | 7.7% | 6.4% |
| Median | 6.3% | 6.0% |
| Interquartile 25% (IQ1) | 5.0% | 5.1% |
| Interquartile 75% (IQ3) | 8.7% | 6.6% |
| Interquartile Range (IQR) | 3.7% | 1.6% |
| Standard Deviation (Sample) | 4.8% | 3.0% |
| Standard Deviation (Population) | 4.8% | 2.9% |
Demographics Similar to Chileans and Guatemalans by Disability Age 18 to 34
In terms of disability age 18 to 34, the demographic groups most similar to Chileans are Immigrants from Ukraine (6.3%, a difference of 0.030%), Immigrants from Guatemala (6.3%, a difference of 0.030%), Immigrants from Nepal (6.3%, a difference of 0.050%), Immigrants from Czechoslovakia (6.3%, a difference of 0.050%), and Immigrants from Costa Rica (6.3%, a difference of 0.15%). Similarly, the demographic groups most similar to Guatemalans are Brazilian (6.4%, a difference of 0.12%), Immigrants from Europe (6.4%, a difference of 0.15%), Immigrants from Saudi Arabia (6.3%, a difference of 0.16%), Immigrants from Dominica (6.3%, a difference of 0.18%), and Immigrants from Italy (6.3%, a difference of 0.19%).
| Demographics | Rating | Rank | Disability Age 18 to 34 |
| Koreans | 94.1 /100 | #115 | Exceptional 6.3% |
| Immigrants | Costa Rica | 94.0 /100 | #116 | Exceptional 6.3% |
| Immigrants | Jordan | 94.0 /100 | #117 | Exceptional 6.3% |
| Immigrants | Nepal | 93.7 /100 | #118 | Exceptional 6.3% |
| Chileans | 93.5 /100 | #119 | Exceptional 6.3% |
| Immigrants | Ukraine | 93.4 /100 | #120 | Exceptional 6.3% |
| Immigrants | Guatemala | 93.4 /100 | #121 | Exceptional 6.3% |
| Immigrants | Czechoslovakia | 93.3 /100 | #122 | Exceptional 6.3% |
| Costa Ricans | 92.9 /100 | #123 | Exceptional 6.3% |
| Immigrants | Morocco | 92.9 /100 | #124 | Exceptional 6.3% |
| Macedonians | 92.6 /100 | #125 | Exceptional 6.3% |
| Immigrants | Switzerland | 92.5 /100 | #126 | Exceptional 6.3% |
| West Indians | 92.0 /100 | #127 | Exceptional 6.3% |
| Chinese | 91.9 /100 | #128 | Exceptional 6.3% |
| Immigrants | Italy | 90.5 /100 | #129 | Exceptional 6.3% |
| Immigrants | Dominica | 90.5 /100 | #130 | Exceptional 6.3% |
| Immigrants | Saudi Arabia | 90.4 /100 | #131 | Exceptional 6.3% |
| Guatemalans | 89.6 /100 | #132 | Excellent 6.4% |
| Brazilians | 89.0 /100 | #133 | Excellent 6.4% |
| Immigrants | Europe | 88.8 /100 | #134 | Excellent 6.4% |
| Palestinians | 88.5 /100 | #135 | Excellent 6.4% |