Chilean vs Immigrants from Eastern Europe Disability Age Under 5
COMPARE
Chilean
Immigrants from Eastern Europe
Disability Age Under 5
Disability Age Under 5 Comparison
Chileans
Immigrants from Eastern Europe
1.3%
DISABILITY AGE UNDER 5
18.8/ 100
METRIC RATING
212th/ 347
METRIC RANK
1.2%
DISABILITY AGE UNDER 5
87.3/ 100
METRIC RATING
132nd/ 347
METRIC RANK
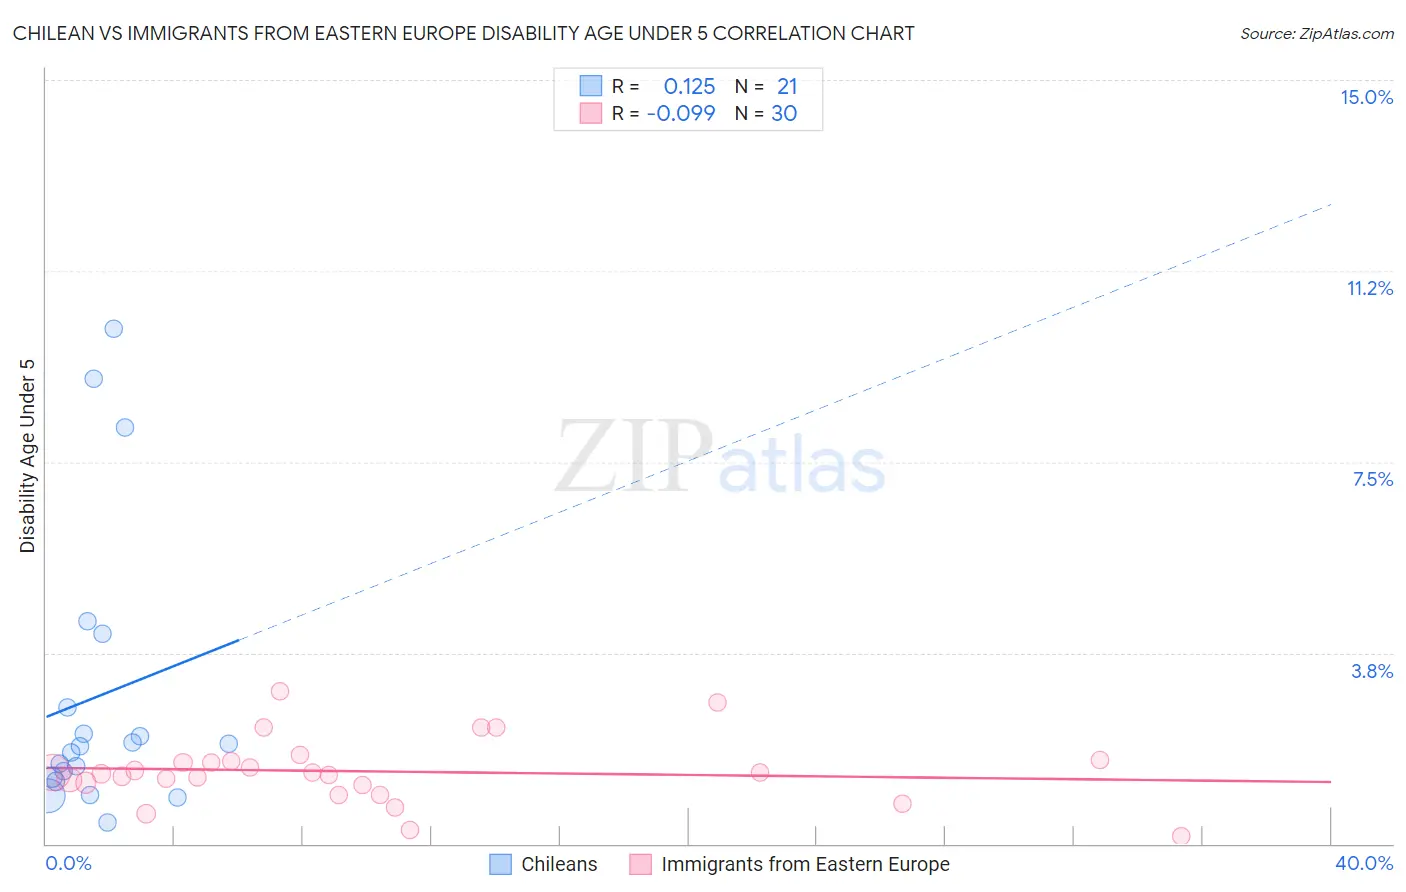
Chilean vs Immigrants from Eastern Europe Disability Age Under 5 Correlation Chart
The statistical analysis conducted on geographies consisting of 158,592,796 people shows a poor positive correlation between the proportion of Chileans and percentage of population with a disability under the age of 5 in the United States with a correlation coefficient (R) of 0.125 and weighted average of 1.3%. Similarly, the statistical analysis conducted on geographies consisting of 238,831,342 people shows a slight negative correlation between the proportion of Immigrants from Eastern Europe and percentage of population with a disability under the age of 5 in the United States with a correlation coefficient (R) of -0.099 and weighted average of 1.2%, a difference of 8.0%.
Disability Age Under 5 Correlation Summary
| Measurement | Chilean | Immigrants from Eastern Europe |
| Minimum | 0.43% | 0.14% |
| Maximum | 10.1% | 3.0% |
| Range | 9.7% | 2.8% |
| Mean | 2.9% | 1.4% |
| Median | 1.9% | 1.4% |
| Interquartile 25% (IQ1) | 1.3% | 1.1% |
| Interquartile 75% (IQ3) | 3.4% | 1.6% |
| Interquartile Range (IQR) | 2.1% | 0.47% |
| Standard Deviation (Sample) | 2.8% | 0.64% |
| Standard Deviation (Population) | 2.7% | 0.63% |
Similar Demographics by Disability Age Under 5
Demographics Similar to Chileans by Disability Age Under 5
In terms of disability age under 5, the demographic groups most similar to Chileans are Immigrants from Sudan (1.3%, a difference of 0.010%), Immigrants from Greece (1.3%, a difference of 0.040%), Bulgarian (1.3%, a difference of 0.090%), Pakistani (1.3%, a difference of 0.090%), and Immigrants from Chile (1.3%, a difference of 0.24%).
| Demographics | Rating | Rank | Disability Age Under 5 |
| Romanians | 22.5 /100 | #205 | Fair 1.3% |
| Immigrants | Poland | 22.4 /100 | #206 | Fair 1.3% |
| Nigerians | 21.2 /100 | #207 | Fair 1.3% |
| Mexicans | 20.8 /100 | #208 | Fair 1.3% |
| Bulgarians | 19.5 /100 | #209 | Poor 1.3% |
| Pakistanis | 19.4 /100 | #210 | Poor 1.3% |
| Immigrants | Greece | 19.1 /100 | #211 | Poor 1.3% |
| Chileans | 18.8 /100 | #212 | Poor 1.3% |
| Immigrants | Sudan | 18.7 /100 | #213 | Poor 1.3% |
| Immigrants | Chile | 17.2 /100 | #214 | Poor 1.3% |
| Syrians | 16.1 /100 | #215 | Poor 1.3% |
| Bangladeshis | 15.5 /100 | #216 | Poor 1.3% |
| Cypriots | 14.9 /100 | #217 | Poor 1.3% |
| Malaysians | 13.2 /100 | #218 | Poor 1.3% |
| Immigrants | Croatia | 11.2 /100 | #219 | Poor 1.3% |
Demographics Similar to Immigrants from Eastern Europe by Disability Age Under 5
In terms of disability age under 5, the demographic groups most similar to Immigrants from Eastern Europe are Immigrants from Serbia (1.2%, a difference of 0.070%), Korean (1.2%, a difference of 0.090%), Immigrants (1.2%, a difference of 0.16%), Immigrants from Spain (1.2%, a difference of 0.16%), and Immigrants from France (1.2%, a difference of 0.25%).
| Demographics | Rating | Rank | Disability Age Under 5 |
| Japanese | 90.3 /100 | #125 | Exceptional 1.2% |
| Central Americans | 89.7 /100 | #126 | Excellent 1.2% |
| Immigrants | Romania | 88.4 /100 | #127 | Excellent 1.2% |
| Immigrants | France | 88.4 /100 | #128 | Excellent 1.2% |
| Immigrants | Immigrants | 88.0 /100 | #129 | Excellent 1.2% |
| Koreans | 87.7 /100 | #130 | Excellent 1.2% |
| Immigrants | Serbia | 87.6 /100 | #131 | Excellent 1.2% |
| Immigrants | Eastern Europe | 87.3 /100 | #132 | Excellent 1.2% |
| Immigrants | Spain | 86.5 /100 | #133 | Excellent 1.2% |
| Argentineans | 85.7 /100 | #134 | Excellent 1.2% |
| Fijians | 84.7 /100 | #135 | Excellent 1.2% |
| Moroccans | 83.6 /100 | #136 | Excellent 1.2% |
| Immigrants | Eastern Africa | 83.1 /100 | #137 | Excellent 1.2% |
| Immigrants | Czechoslovakia | 82.8 /100 | #138 | Excellent 1.2% |
| New Zealanders | 81.4 /100 | #139 | Excellent 1.2% |