Chilean vs Immigrants from Caribbean Disability Age Under 5
COMPARE
Chilean
Immigrants from Caribbean
Disability Age Under 5
Disability Age Under 5 Comparison
Chileans
Immigrants from Caribbean
1.3%
DISABILITY AGE UNDER 5
18.8/ 100
METRIC RATING
212th/ 347
METRIC RANK
1.2%
DISABILITY AGE UNDER 5
93.8/ 100
METRIC RATING
115th/ 347
METRIC RANK
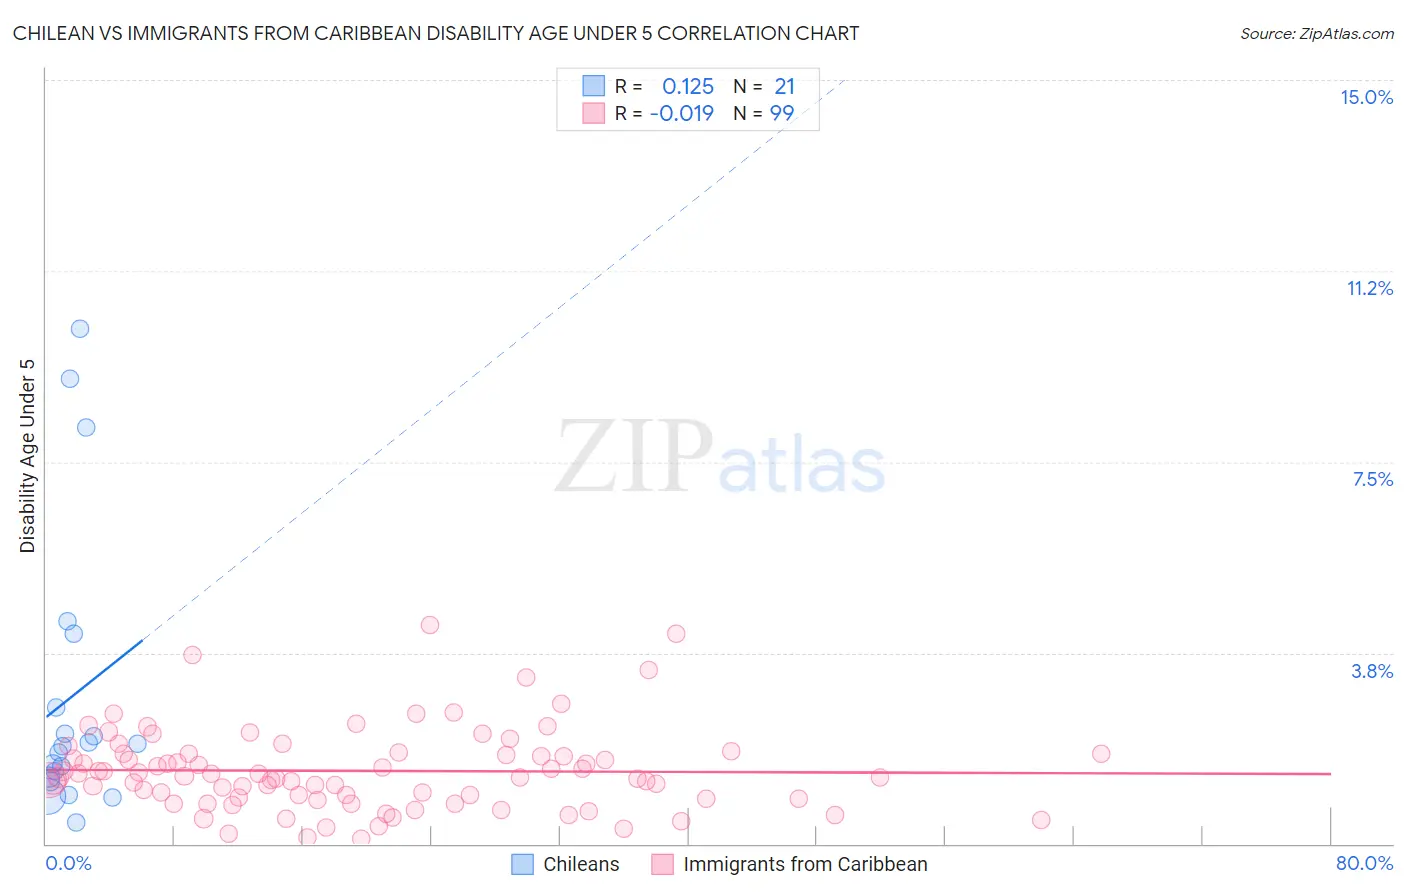
Chilean vs Immigrants from Caribbean Disability Age Under 5 Correlation Chart
The statistical analysis conducted on geographies consisting of 158,592,796 people shows a poor positive correlation between the proportion of Chileans and percentage of population with a disability under the age of 5 in the United States with a correlation coefficient (R) of 0.125 and weighted average of 1.3%. Similarly, the statistical analysis conducted on geographies consisting of 233,002,612 people shows no correlation between the proportion of Immigrants from Caribbean and percentage of population with a disability under the age of 5 in the United States with a correlation coefficient (R) of -0.019 and weighted average of 1.2%, a difference of 10.1%.
Disability Age Under 5 Correlation Summary
| Measurement | Chilean | Immigrants from Caribbean |
| Minimum | 0.43% | 0.090% |
| Maximum | 10.1% | 4.3% |
| Range | 9.7% | 4.2% |
| Mean | 2.9% | 1.4% |
| Median | 1.9% | 1.3% |
| Interquartile 25% (IQ1) | 1.3% | 0.88% |
| Interquartile 75% (IQ3) | 3.4% | 1.8% |
| Interquartile Range (IQR) | 2.1% | 0.88% |
| Standard Deviation (Sample) | 2.8% | 0.81% |
| Standard Deviation (Population) | 2.7% | 0.80% |
Similar Demographics by Disability Age Under 5
Demographics Similar to Chileans by Disability Age Under 5
In terms of disability age under 5, the demographic groups most similar to Chileans are Immigrants from Sudan (1.3%, a difference of 0.010%), Immigrants from Greece (1.3%, a difference of 0.040%), Bulgarian (1.3%, a difference of 0.090%), Pakistani (1.3%, a difference of 0.090%), and Immigrants from Chile (1.3%, a difference of 0.24%).
| Demographics | Rating | Rank | Disability Age Under 5 |
| Romanians | 22.5 /100 | #205 | Fair 1.3% |
| Immigrants | Poland | 22.4 /100 | #206 | Fair 1.3% |
| Nigerians | 21.2 /100 | #207 | Fair 1.3% |
| Mexicans | 20.8 /100 | #208 | Fair 1.3% |
| Bulgarians | 19.5 /100 | #209 | Poor 1.3% |
| Pakistanis | 19.4 /100 | #210 | Poor 1.3% |
| Immigrants | Greece | 19.1 /100 | #211 | Poor 1.3% |
| Chileans | 18.8 /100 | #212 | Poor 1.3% |
| Immigrants | Sudan | 18.7 /100 | #213 | Poor 1.3% |
| Immigrants | Chile | 17.2 /100 | #214 | Poor 1.3% |
| Syrians | 16.1 /100 | #215 | Poor 1.3% |
| Bangladeshis | 15.5 /100 | #216 | Poor 1.3% |
| Cypriots | 14.9 /100 | #217 | Poor 1.3% |
| Malaysians | 13.2 /100 | #218 | Poor 1.3% |
| Immigrants | Croatia | 11.2 /100 | #219 | Poor 1.3% |
Demographics Similar to Immigrants from Caribbean by Disability Age Under 5
In terms of disability age under 5, the demographic groups most similar to Immigrants from Caribbean are Belizean (1.2%, a difference of 0.010%), Immigrants from Northern Africa (1.2%, a difference of 0.020%), Immigrants from Philippines (1.2%, a difference of 0.15%), Immigrants from Oceania (1.2%, a difference of 0.16%), and Immigrants from Venezuela (1.2%, a difference of 0.19%).
| Demographics | Rating | Rank | Disability Age Under 5 |
| Iraqis | 95.1 /100 | #108 | Exceptional 1.2% |
| Immigrants | Panama | 95.0 /100 | #109 | Exceptional 1.2% |
| Immigrants | Lebanon | 95.0 /100 | #110 | Exceptional 1.2% |
| Senegalese | 94.6 /100 | #111 | Exceptional 1.2% |
| Immigrants | Australia | 94.4 /100 | #112 | Exceptional 1.2% |
| Immigrants | Oceania | 94.2 /100 | #113 | Exceptional 1.2% |
| Belizeans | 93.9 /100 | #114 | Exceptional 1.2% |
| Immigrants | Caribbean | 93.8 /100 | #115 | Exceptional 1.2% |
| Immigrants | Northern Africa | 93.8 /100 | #116 | Exceptional 1.2% |
| Immigrants | Philippines | 93.5 /100 | #117 | Exceptional 1.2% |
| Immigrants | Venezuela | 93.4 /100 | #118 | Exceptional 1.2% |
| Bhutanese | 92.5 /100 | #119 | Exceptional 1.2% |
| Immigrants | Eritrea | 92.3 /100 | #120 | Exceptional 1.2% |
| Immigrants | Senegal | 91.4 /100 | #121 | Exceptional 1.2% |
| Aleuts | 90.7 /100 | #122 | Exceptional 1.2% |