Immigrants from Uzbekistan vs Kenyan Female Disability
COMPARE
Immigrants from Uzbekistan
Kenyan
Female Disability
Female Disability Comparison
Immigrants from Uzbekistan
Kenyans
12.3%
FEMALE DISABILITY
33.9/ 100
METRIC RATING
185th/ 347
METRIC RANK
11.9%
FEMALE DISABILITY
94.5/ 100
METRIC RATING
133rd/ 347
METRIC RANK
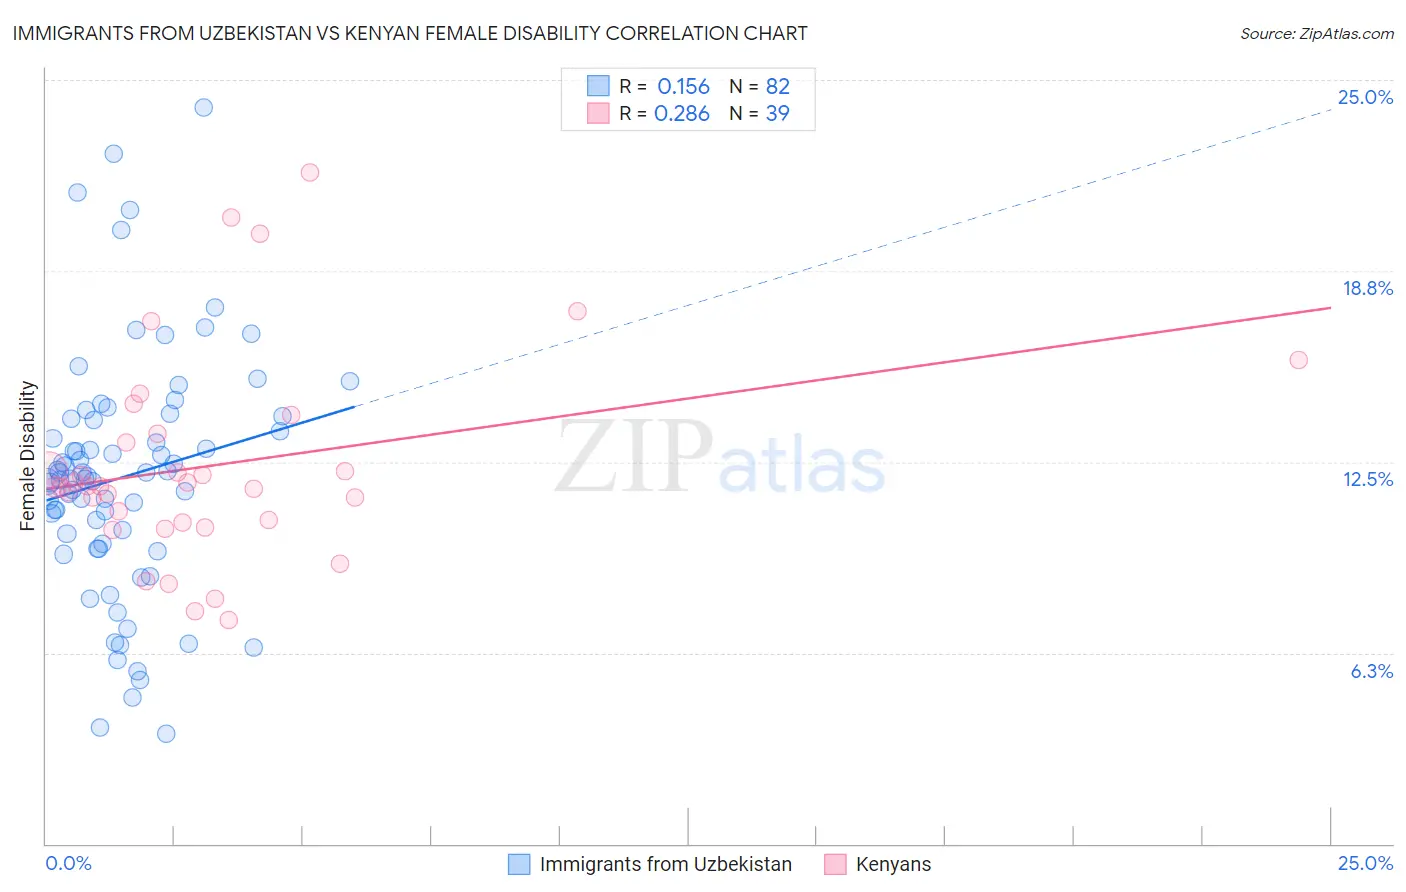
Immigrants from Uzbekistan vs Kenyan Female Disability Correlation Chart
The statistical analysis conducted on geographies consisting of 118,753,500 people shows a poor positive correlation between the proportion of Immigrants from Uzbekistan and percentage of females with a disability in the United States with a correlation coefficient (R) of 0.156 and weighted average of 12.3%. Similarly, the statistical analysis conducted on geographies consisting of 168,210,759 people shows a weak positive correlation between the proportion of Kenyans and percentage of females with a disability in the United States with a correlation coefficient (R) of 0.286 and weighted average of 11.9%, a difference of 3.4%.
Female Disability Correlation Summary
| Measurement | Immigrants from Uzbekistan | Kenyan |
| Minimum | 3.6% | 7.3% |
| Maximum | 24.1% | 22.0% |
| Range | 20.5% | 14.6% |
| Mean | 12.0% | 12.4% |
| Median | 12.0% | 11.7% |
| Interquartile 25% (IQ1) | 9.8% | 10.5% |
| Interquartile 75% (IQ3) | 13.9% | 13.4% |
| Interquartile Range (IQR) | 4.1% | 2.9% |
| Standard Deviation (Sample) | 4.0% | 3.3% |
| Standard Deviation (Population) | 3.9% | 3.3% |
Similar Demographics by Female Disability
Demographics Similar to Immigrants from Uzbekistan by Female Disability
In terms of female disability, the demographic groups most similar to Immigrants from Uzbekistan are Austrian (12.3%, a difference of 0.020%), Serbian (12.3%, a difference of 0.030%), Immigrants from North America (12.3%, a difference of 0.050%), Iraqi (12.3%, a difference of 0.080%), and Cuban (12.3%, a difference of 0.10%).
| Demographics | Rating | Rank | Female Disability |
| Immigrants | Western Europe | 40.9 /100 | #178 | Average 12.2% |
| Immigrants | Fiji | 38.2 /100 | #179 | Fair 12.3% |
| Albanians | 37.9 /100 | #180 | Fair 12.3% |
| Immigrants | Canada | 37.2 /100 | #181 | Fair 12.3% |
| Norwegians | 36.9 /100 | #182 | Fair 12.3% |
| Cubans | 36.5 /100 | #183 | Fair 12.3% |
| Iraqis | 36.0 /100 | #184 | Fair 12.3% |
| Immigrants | Uzbekistan | 33.9 /100 | #185 | Fair 12.3% |
| Austrians | 33.3 /100 | #186 | Fair 12.3% |
| Serbians | 33.1 /100 | #187 | Fair 12.3% |
| Immigrants | North America | 32.8 /100 | #188 | Fair 12.3% |
| Immigrants | Albania | 31.6 /100 | #189 | Fair 12.3% |
| Immigrants | Honduras | 31.3 /100 | #190 | Fair 12.3% |
| Armenians | 29.7 /100 | #191 | Fair 12.3% |
| Immigrants | Western Africa | 29.2 /100 | #192 | Fair 12.3% |
Demographics Similar to Kenyans by Female Disability
In terms of female disability, the demographic groups most similar to Kenyans are Immigrants from Nicaragua (11.9%, a difference of 0.0%), Immigrants from Syria (11.9%, a difference of 0.010%), Central American (11.9%, a difference of 0.070%), Ugandan (11.9%, a difference of 0.090%), and Arab (11.9%, a difference of 0.11%).
| Demographics | Rating | Rank | Female Disability |
| Immigrants | Europe | 96.2 /100 | #126 | Exceptional 11.8% |
| South American Indians | 95.8 /100 | #127 | Exceptional 11.8% |
| Immigrants | Latvia | 95.6 /100 | #128 | Exceptional 11.8% |
| Macedonians | 95.5 /100 | #129 | Exceptional 11.8% |
| Nicaraguans | 95.2 /100 | #130 | Exceptional 11.9% |
| Arabs | 95.1 /100 | #131 | Exceptional 11.9% |
| Immigrants | Syria | 94.6 /100 | #132 | Exceptional 11.9% |
| Kenyans | 94.5 /100 | #133 | Exceptional 11.9% |
| Immigrants | Nicaragua | 94.5 /100 | #134 | Exceptional 11.9% |
| Central Americans | 94.2 /100 | #135 | Exceptional 11.9% |
| Ugandans | 94.0 /100 | #136 | Exceptional 11.9% |
| Immigrants | Norway | 93.8 /100 | #137 | Exceptional 11.9% |
| Ecuadorians | 93.4 /100 | #138 | Exceptional 11.9% |
| Immigrants | Hungary | 92.8 /100 | #139 | Exceptional 11.9% |
| Romanians | 91.6 /100 | #140 | Exceptional 11.9% |