Cheyenne vs Immigrants from Egypt Disability Age 65 to 74
COMPARE
Cheyenne
Immigrants from Egypt
Disability Age 65 to 74
Disability Age 65 to 74 Comparison
Cheyenne
Immigrants from Egypt
31.1%
DISABILITY AGE 65 TO 74
0.0/ 100
METRIC RATING
335th/ 347
METRIC RANK
21.7%
DISABILITY AGE 65 TO 74
99.2/ 100
METRIC RATING
69th/ 347
METRIC RANK
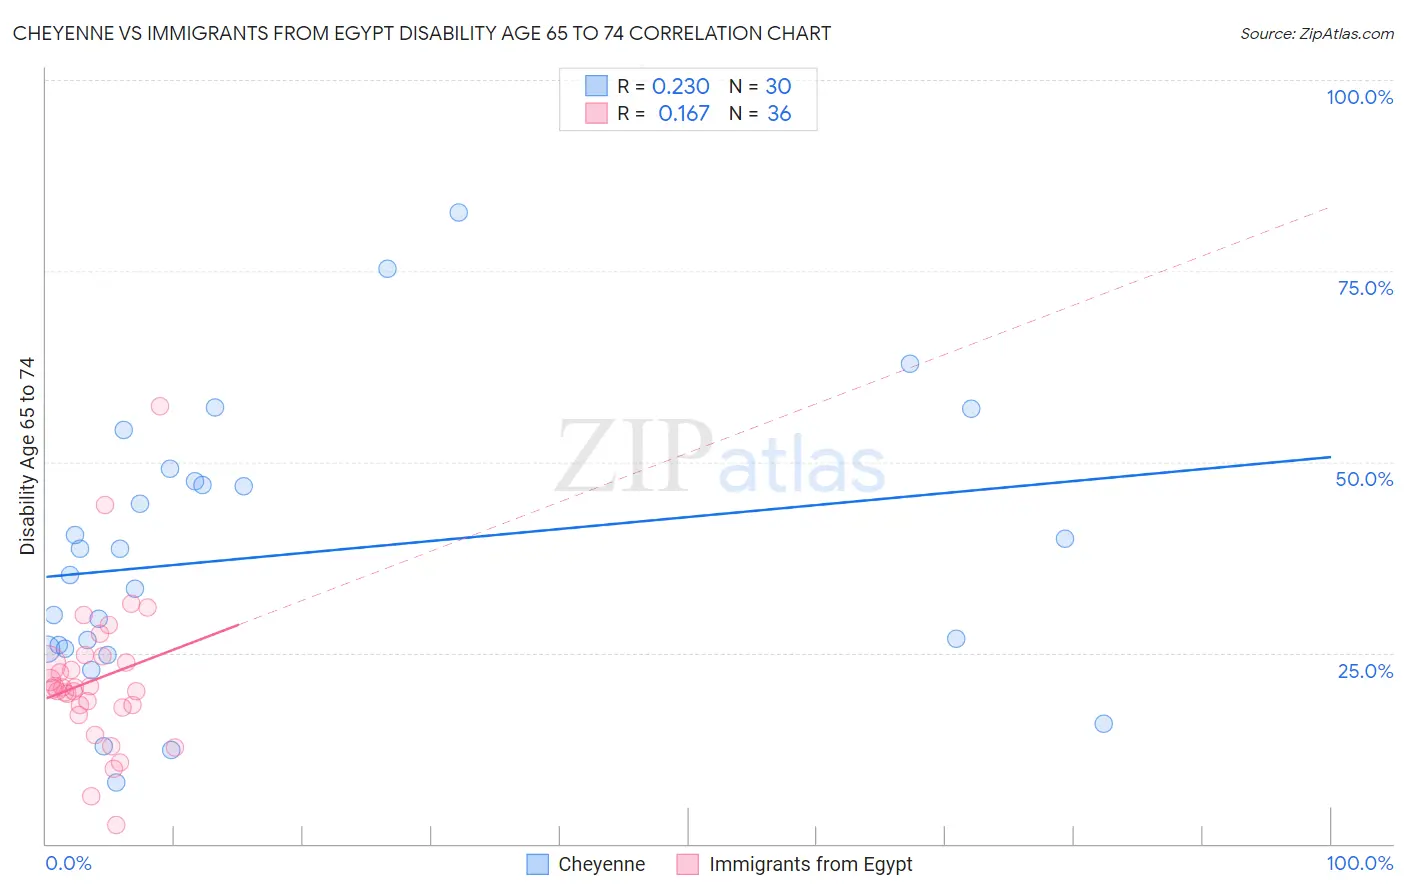
Cheyenne vs Immigrants from Egypt Disability Age 65 to 74 Correlation Chart
The statistical analysis conducted on geographies consisting of 80,698,325 people shows a weak positive correlation between the proportion of Cheyenne and percentage of population with a disability between the ages 65 and 75 in the United States with a correlation coefficient (R) of 0.230 and weighted average of 31.1%. Similarly, the statistical analysis conducted on geographies consisting of 245,305,558 people shows a poor positive correlation between the proportion of Immigrants from Egypt and percentage of population with a disability between the ages 65 and 75 in the United States with a correlation coefficient (R) of 0.167 and weighted average of 21.7%, a difference of 43.1%.
Disability Age 65 to 74 Correlation Summary
| Measurement | Cheyenne | Immigrants from Egypt |
| Minimum | 8.0% | 2.4% |
| Maximum | 82.6% | 57.3% |
| Range | 74.6% | 54.9% |
| Mean | 37.9% | 21.5% |
| Median | 36.9% | 20.4% |
| Interquartile 25% (IQ1) | 25.5% | 18.0% |
| Interquartile 75% (IQ3) | 47.5% | 24.2% |
| Interquartile Range (IQR) | 22.0% | 6.2% |
| Standard Deviation (Sample) | 18.0% | 9.7% |
| Standard Deviation (Population) | 17.7% | 9.6% |
Similar Demographics by Disability Age 65 to 74
Demographics Similar to Cheyenne by Disability Age 65 to 74
In terms of disability age 65 to 74, the demographic groups most similar to Cheyenne are Yuman (31.5%, a difference of 1.3%), Alaska Native (30.6%, a difference of 1.4%), Colville (30.5%, a difference of 1.7%), Native/Alaskan (30.4%, a difference of 2.2%), and Chickasaw (30.2%, a difference of 2.9%).
| Demographics | Rating | Rank | Disability Age 65 to 74 |
| Hopi | 0.0 /100 | #328 | Tragic 30.0% |
| Choctaw | 0.0 /100 | #329 | Tragic 30.2% |
| Creek | 0.0 /100 | #330 | Tragic 30.2% |
| Chickasaw | 0.0 /100 | #331 | Tragic 30.2% |
| Natives/Alaskans | 0.0 /100 | #332 | Tragic 30.4% |
| Colville | 0.0 /100 | #333 | Tragic 30.5% |
| Alaska Natives | 0.0 /100 | #334 | Tragic 30.6% |
| Cheyenne | 0.0 /100 | #335 | Tragic 31.1% |
| Yuman | 0.0 /100 | #336 | Tragic 31.5% |
| Houma | 0.0 /100 | #337 | Tragic 32.3% |
| Alaskan Athabascans | 0.0 /100 | #338 | Tragic 32.4% |
| Kiowa | 0.0 /100 | #339 | Tragic 32.6% |
| Lumbee | 0.0 /100 | #340 | Tragic 32.7% |
| Tsimshian | 0.0 /100 | #341 | Tragic 32.9% |
| Pueblo | 0.0 /100 | #342 | Tragic 33.1% |
Demographics Similar to Immigrants from Egypt by Disability Age 65 to 74
In terms of disability age 65 to 74, the demographic groups most similar to Immigrants from Egypt are Chinese (21.7%, a difference of 0.0%), Immigrants from Belarus (21.7%, a difference of 0.060%), Immigrants from Hungary (21.7%, a difference of 0.070%), Immigrants from Scotland (21.7%, a difference of 0.13%), and Immigrants from South Africa (21.7%, a difference of 0.22%).
| Demographics | Rating | Rank | Disability Age 65 to 74 |
| Carpatho Rusyns | 99.5 /100 | #62 | Exceptional 21.6% |
| Immigrants | Europe | 99.4 /100 | #63 | Exceptional 21.6% |
| Immigrants | Latvia | 99.4 /100 | #64 | Exceptional 21.6% |
| Immigrants | Russia | 99.4 /100 | #65 | Exceptional 21.6% |
| Maltese | 99.4 /100 | #66 | Exceptional 21.6% |
| Immigrants | South Africa | 99.3 /100 | #67 | Exceptional 21.7% |
| Immigrants | Scotland | 99.3 /100 | #68 | Exceptional 21.7% |
| Immigrants | Egypt | 99.2 /100 | #69 | Exceptional 21.7% |
| Chinese | 99.2 /100 | #70 | Exceptional 21.7% |
| Immigrants | Belarus | 99.2 /100 | #71 | Exceptional 21.7% |
| Immigrants | Hungary | 99.2 /100 | #72 | Exceptional 21.7% |
| Immigrants | Venezuela | 99.0 /100 | #73 | Exceptional 21.8% |
| Cambodians | 99.0 /100 | #74 | Exceptional 21.8% |
| Mongolians | 99.0 /100 | #75 | Exceptional 21.8% |
| Greeks | 99.0 /100 | #76 | Exceptional 21.8% |