Cherokee vs Kenyan Cognitive Disability
COMPARE
Cherokee
Kenyan
Cognitive Disability
Cognitive Disability Comparison
Cherokee
Kenyans
18.0%
COGNITIVE DISABILITY
0.3/ 100
METRIC RATING
268th/ 347
METRIC RANK
18.1%
COGNITIVE DISABILITY
0.1/ 100
METRIC RATING
286th/ 347
METRIC RANK
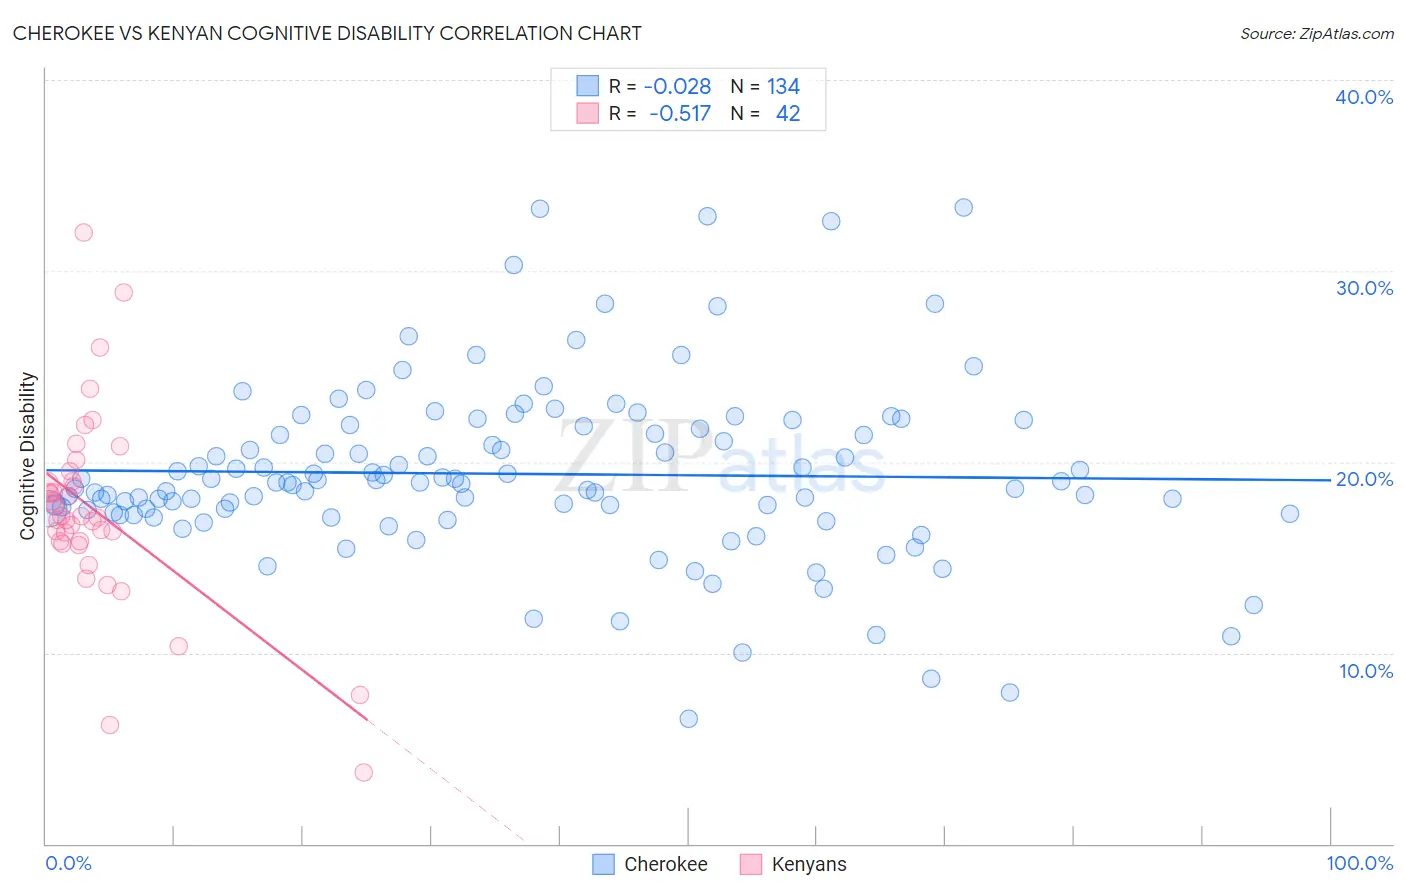
Cherokee vs Kenyan Cognitive Disability Correlation Chart
The statistical analysis conducted on geographies consisting of 493,579,775 people shows no correlation between the proportion of Cherokee and percentage of population with cognitive disability in the United States with a correlation coefficient (R) of -0.028 and weighted average of 18.0%. Similarly, the statistical analysis conducted on geographies consisting of 168,212,811 people shows a substantial negative correlation between the proportion of Kenyans and percentage of population with cognitive disability in the United States with a correlation coefficient (R) of -0.517 and weighted average of 18.1%, a difference of 0.84%.
Cognitive Disability Correlation Summary
| Measurement | Cherokee | Kenyan |
| Minimum | 6.5% | 3.7% |
| Maximum | 33.3% | 32.0% |
| Range | 26.8% | 28.2% |
| Mean | 19.4% | 17.4% |
| Median | 18.9% | 17.1% |
| Interquartile 25% (IQ1) | 17.4% | 15.8% |
| Interquartile 75% (IQ3) | 21.8% | 19.0% |
| Interquartile Range (IQR) | 4.4% | 3.2% |
| Standard Deviation (Sample) | 4.6% | 5.1% |
| Standard Deviation (Population) | 4.6% | 5.1% |
Demographics Similar to Cherokee and Kenyans by Cognitive Disability
In terms of cognitive disability, the demographic groups most similar to Cherokee are Nepalese (18.0%, a difference of 0.010%), Honduran (18.0%, a difference of 0.14%), Immigrants from Bahamas (18.0%, a difference of 0.15%), Potawatomi (18.0%, a difference of 0.22%), and Immigrants from Honduras (18.0%, a difference of 0.24%). Similarly, the demographic groups most similar to Kenyans are Bermudan (18.1%, a difference of 0.040%), Dutch West Indian (18.1%, a difference of 0.040%), Immigrants from Uganda (18.1%, a difference of 0.050%), Nigerian (18.1%, a difference of 0.090%), and Immigrants from Cambodia (18.1%, a difference of 0.11%).
| Demographics | Rating | Rank | Cognitive Disability |
| Nepalese | 0.3 /100 | #267 | Tragic 18.0% |
| Cherokee | 0.3 /100 | #268 | Tragic 18.0% |
| Hondurans | 0.3 /100 | #269 | Tragic 18.0% |
| Immigrants | Bahamas | 0.3 /100 | #270 | Tragic 18.0% |
| Potawatomi | 0.2 /100 | #271 | Tragic 18.0% |
| Immigrants | Honduras | 0.2 /100 | #272 | Tragic 18.0% |
| Immigrants | Nepal | 0.2 /100 | #273 | Tragic 18.0% |
| Immigrants | Nigeria | 0.2 /100 | #274 | Tragic 18.0% |
| Immigrants | Laos | 0.2 /100 | #275 | Tragic 18.1% |
| Yuman | 0.2 /100 | #276 | Tragic 18.1% |
| Immigrants | Kuwait | 0.2 /100 | #277 | Tragic 18.1% |
| Immigrants | Micronesia | 0.2 /100 | #278 | Tragic 18.1% |
| Chippewa | 0.1 /100 | #279 | Tragic 18.1% |
| West Indians | 0.1 /100 | #280 | Tragic 18.1% |
| Yakama | 0.1 /100 | #281 | Tragic 18.1% |
| Immigrants | Cambodia | 0.1 /100 | #282 | Tragic 18.1% |
| Nigerians | 0.1 /100 | #283 | Tragic 18.1% |
| Immigrants | Uganda | 0.1 /100 | #284 | Tragic 18.1% |
| Bermudans | 0.1 /100 | #285 | Tragic 18.1% |
| Kenyans | 0.1 /100 | #286 | Tragic 18.1% |
| Dutch West Indians | 0.1 /100 | #287 | Tragic 18.1% |