Luxembourger vs Immigrants from Syria Cognitive Disability
COMPARE
Luxembourger
Immigrants from Syria
Cognitive Disability
Cognitive Disability Comparison
Luxembourgers
Immigrants from Syria
16.4%
COGNITIVE DISABILITY
99.9/ 100
METRIC RATING
25th/ 347
METRIC RANK
17.2%
COGNITIVE DISABILITY
63.5/ 100
METRIC RATING
167th/ 347
METRIC RANK
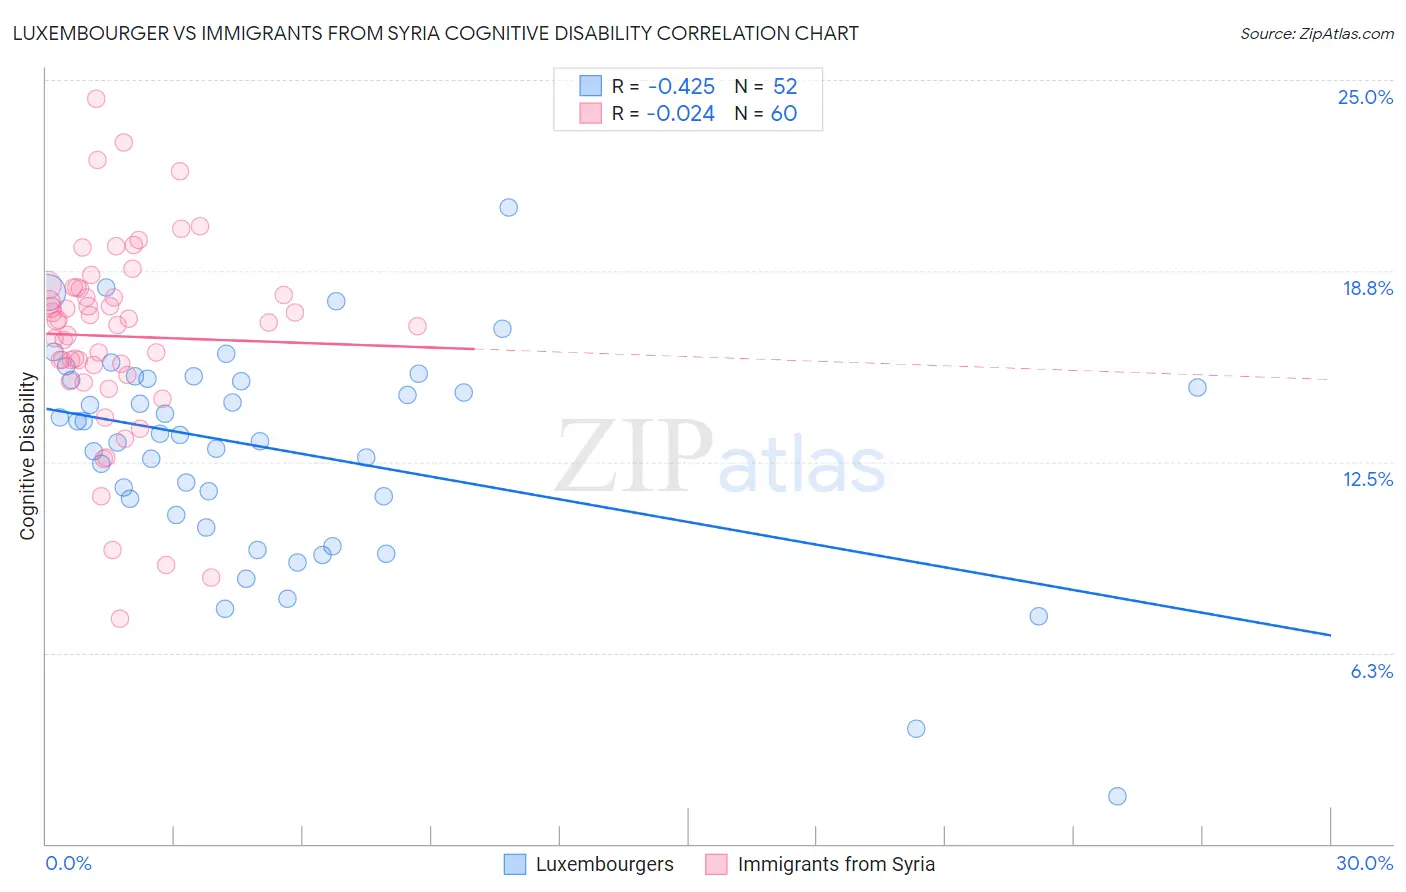
Luxembourger vs Immigrants from Syria Cognitive Disability Correlation Chart
The statistical analysis conducted on geographies consisting of 144,680,571 people shows a moderate negative correlation between the proportion of Luxembourgers and percentage of population with cognitive disability in the United States with a correlation coefficient (R) of -0.425 and weighted average of 16.4%. Similarly, the statistical analysis conducted on geographies consisting of 174,112,347 people shows no correlation between the proportion of Immigrants from Syria and percentage of population with cognitive disability in the United States with a correlation coefficient (R) of -0.024 and weighted average of 17.2%, a difference of 5.1%.
Cognitive Disability Correlation Summary
| Measurement | Luxembourger | Immigrants from Syria |
| Minimum | 1.6% | 7.4% |
| Maximum | 20.8% | 24.4% |
| Range | 19.3% | 17.0% |
| Mean | 12.9% | 16.6% |
| Median | 13.4% | 17.1% |
| Interquartile 25% (IQ1) | 11.0% | 15.5% |
| Interquartile 75% (IQ3) | 15.2% | 18.2% |
| Interquartile Range (IQR) | 4.2% | 2.7% |
| Standard Deviation (Sample) | 3.5% | 3.2% |
| Standard Deviation (Population) | 3.5% | 3.2% |
Similar Demographics by Cognitive Disability
Demographics Similar to Luxembourgers by Cognitive Disability
In terms of cognitive disability, the demographic groups most similar to Luxembourgers are Immigrants from Croatia (16.4%, a difference of 0.030%), Immigrants from Argentina (16.4%, a difference of 0.040%), Immigrants from Pakistan (16.4%, a difference of 0.050%), Polish (16.4%, a difference of 0.050%), and Croatian (16.4%, a difference of 0.060%).
| Demographics | Rating | Rank | Cognitive Disability |
| Immigrants | Northern Europe | 100.0 /100 | #18 | Exceptional 16.3% |
| Immigrants | Bolivia | 100.0 /100 | #19 | Exceptional 16.3% |
| Bulgarians | 100.0 /100 | #20 | Exceptional 16.3% |
| Immigrants | Cuba | 100.0 /100 | #21 | Exceptional 16.3% |
| Immigrants | South Central Asia | 99.9 /100 | #22 | Exceptional 16.4% |
| Croatians | 99.9 /100 | #23 | Exceptional 16.4% |
| Immigrants | Argentina | 99.9 /100 | #24 | Exceptional 16.4% |
| Luxembourgers | 99.9 /100 | #25 | Exceptional 16.4% |
| Immigrants | Croatia | 99.9 /100 | #26 | Exceptional 16.4% |
| Immigrants | Pakistan | 99.9 /100 | #27 | Exceptional 16.4% |
| Poles | 99.9 /100 | #28 | Exceptional 16.4% |
| Filipinos | 99.9 /100 | #29 | Exceptional 16.4% |
| Czechs | 99.9 /100 | #30 | Exceptional 16.4% |
| Immigrants | Romania | 99.9 /100 | #31 | Exceptional 16.4% |
| Immigrants | Israel | 99.9 /100 | #32 | Exceptional 16.4% |
Demographics Similar to Immigrants from Syria by Cognitive Disability
In terms of cognitive disability, the demographic groups most similar to Immigrants from Syria are Immigrants from Ecuador (17.2%, a difference of 0.030%), Immigrants (17.2%, a difference of 0.030%), Immigrants from Albania (17.2%, a difference of 0.040%), Immigrants from Portugal (17.2%, a difference of 0.050%), and Ecuadorian (17.2%, a difference of 0.12%).
| Demographics | Rating | Rank | Cognitive Disability |
| Australians | 72.4 /100 | #160 | Good 17.2% |
| Americans | 72.2 /100 | #161 | Good 17.2% |
| Yugoslavians | 71.6 /100 | #162 | Good 17.2% |
| Immigrants | Switzerland | 71.5 /100 | #163 | Good 17.2% |
| Armenians | 70.1 /100 | #164 | Good 17.2% |
| Immigrants | Albania | 64.9 /100 | #165 | Good 17.2% |
| Immigrants | Ecuador | 64.4 /100 | #166 | Good 17.2% |
| Immigrants | Syria | 63.5 /100 | #167 | Good 17.2% |
| Immigrants | Immigrants | 62.5 /100 | #168 | Good 17.2% |
| Immigrants | Portugal | 61.8 /100 | #169 | Good 17.2% |
| Ecuadorians | 59.6 /100 | #170 | Average 17.2% |
| Tlingit-Haida | 59.4 /100 | #171 | Average 17.2% |
| Immigrants | Turkey | 56.7 /100 | #172 | Average 17.2% |
| Immigrants | Northern Africa | 50.2 /100 | #173 | Average 17.3% |
| Laotians | 50.0 /100 | #174 | Average 17.3% |