Central American Indian vs Ecuadorian Cognitive Disability
COMPARE
Central American Indian
Ecuadorian
Cognitive Disability
Cognitive Disability Comparison
Central American Indians
Ecuadorians
18.2%
COGNITIVE DISABILITY
0.1/ 100
METRIC RATING
293rd/ 347
METRIC RANK
17.2%
COGNITIVE DISABILITY
59.6/ 100
METRIC RATING
170th/ 347
METRIC RANK
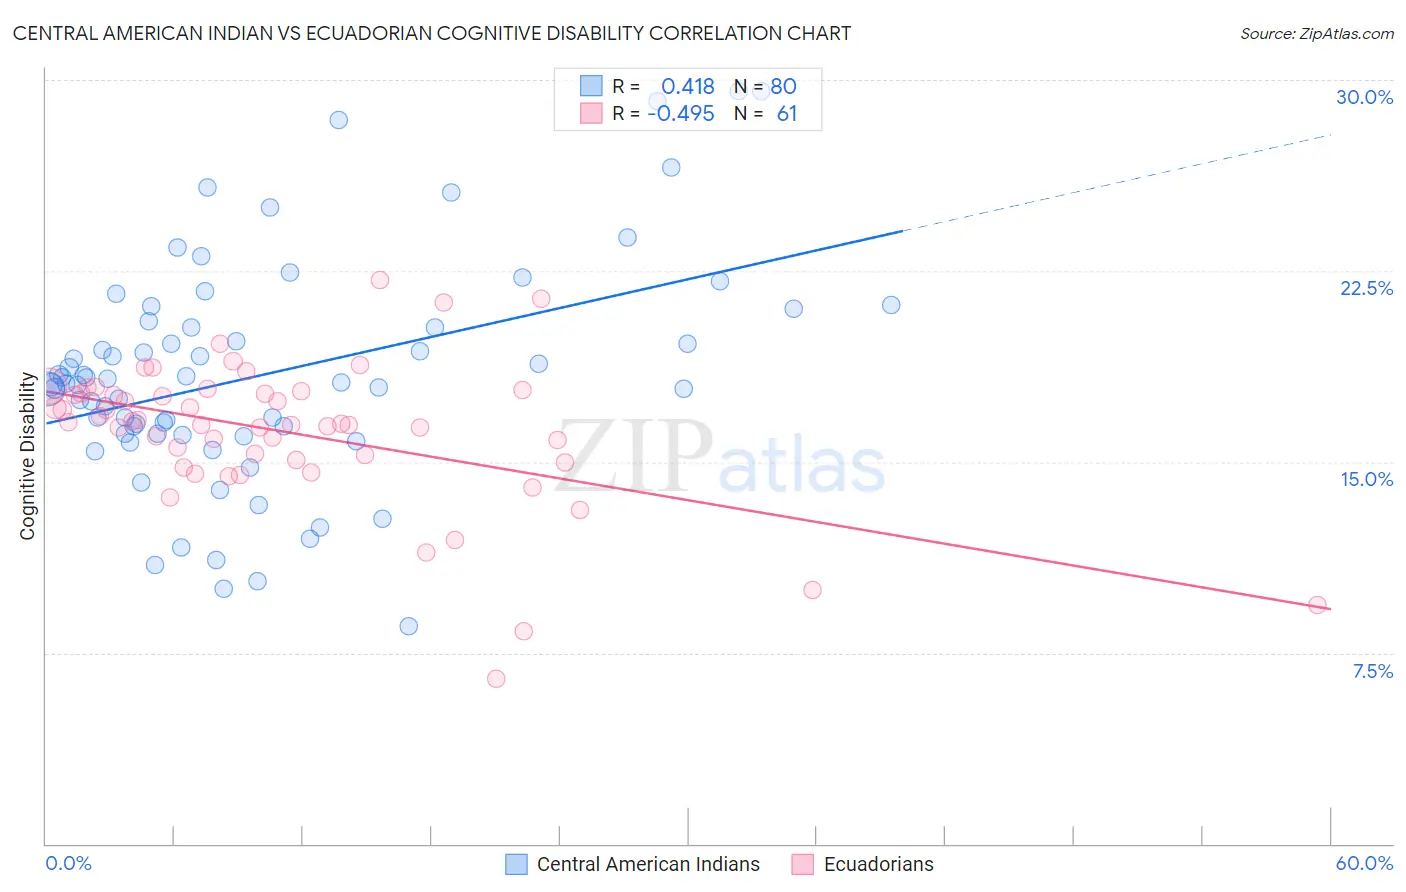
Central American Indian vs Ecuadorian Cognitive Disability Correlation Chart
The statistical analysis conducted on geographies consisting of 326,115,408 people shows a moderate positive correlation between the proportion of Central American Indians and percentage of population with cognitive disability in the United States with a correlation coefficient (R) of 0.418 and weighted average of 18.2%. Similarly, the statistical analysis conducted on geographies consisting of 317,812,387 people shows a moderate negative correlation between the proportion of Ecuadorians and percentage of population with cognitive disability in the United States with a correlation coefficient (R) of -0.495 and weighted average of 17.2%, a difference of 5.6%.
Cognitive Disability Correlation Summary
| Measurement | Central American Indian | Ecuadorian |
| Minimum | 8.5% | 6.5% |
| Maximum | 29.6% | 22.2% |
| Range | 21.0% | 15.7% |
| Mean | 18.4% | 16.2% |
| Median | 18.1% | 16.5% |
| Interquartile 25% (IQ1) | 16.1% | 15.0% |
| Interquartile 75% (IQ3) | 20.4% | 17.7% |
| Interquartile Range (IQR) | 4.3% | 2.7% |
| Standard Deviation (Sample) | 4.4% | 2.9% |
| Standard Deviation (Population) | 4.4% | 2.8% |
Similar Demographics by Cognitive Disability
Demographics Similar to Central American Indians by Cognitive Disability
In terms of cognitive disability, the demographic groups most similar to Central American Indians are Iroquois (18.2%, a difference of 0.010%), British West Indian (18.2%, a difference of 0.070%), Ottawa (18.2%, a difference of 0.080%), Immigrants from Africa (18.1%, a difference of 0.21%), and Native/Alaskan (18.1%, a difference of 0.24%).
| Demographics | Rating | Rank | Cognitive Disability |
| Kenyans | 0.1 /100 | #286 | Tragic 18.1% |
| Dutch West Indians | 0.1 /100 | #287 | Tragic 18.1% |
| Immigrants | West Indies | 0.1 /100 | #288 | Tragic 18.1% |
| Natives/Alaskans | 0.1 /100 | #289 | Tragic 18.1% |
| Immigrants | Africa | 0.1 /100 | #290 | Tragic 18.1% |
| Ottawa | 0.1 /100 | #291 | Tragic 18.2% |
| Iroquois | 0.1 /100 | #292 | Tragic 18.2% |
| Central American Indians | 0.1 /100 | #293 | Tragic 18.2% |
| British West Indians | 0.1 /100 | #294 | Tragic 18.2% |
| German Russians | 0.0 /100 | #295 | Tragic 18.2% |
| Immigrants | Burma/Myanmar | 0.0 /100 | #296 | Tragic 18.2% |
| Blackfeet | 0.0 /100 | #297 | Tragic 18.3% |
| Japanese | 0.0 /100 | #298 | Tragic 18.3% |
| Ghanaians | 0.0 /100 | #299 | Tragic 18.3% |
| Creek | 0.0 /100 | #300 | Tragic 18.3% |
Demographics Similar to Ecuadorians by Cognitive Disability
In terms of cognitive disability, the demographic groups most similar to Ecuadorians are Tlingit-Haida (17.2%, a difference of 0.0%), Immigrants from Portugal (17.2%, a difference of 0.070%), Immigrants (17.2%, a difference of 0.090%), Immigrants from Turkey (17.2%, a difference of 0.090%), and Immigrants from Syria (17.2%, a difference of 0.12%).
| Demographics | Rating | Rank | Cognitive Disability |
| Immigrants | Switzerland | 71.5 /100 | #163 | Good 17.2% |
| Armenians | 70.1 /100 | #164 | Good 17.2% |
| Immigrants | Albania | 64.9 /100 | #165 | Good 17.2% |
| Immigrants | Ecuador | 64.4 /100 | #166 | Good 17.2% |
| Immigrants | Syria | 63.5 /100 | #167 | Good 17.2% |
| Immigrants | Immigrants | 62.5 /100 | #168 | Good 17.2% |
| Immigrants | Portugal | 61.8 /100 | #169 | Good 17.2% |
| Ecuadorians | 59.6 /100 | #170 | Average 17.2% |
| Tlingit-Haida | 59.4 /100 | #171 | Average 17.2% |
| Immigrants | Turkey | 56.7 /100 | #172 | Average 17.2% |
| Immigrants | Northern Africa | 50.2 /100 | #173 | Average 17.3% |
| Laotians | 50.0 /100 | #174 | Average 17.3% |
| Tsimshian | 49.8 /100 | #175 | Average 17.3% |
| Shoshone | 49.2 /100 | #176 | Average 17.3% |
| Ute | 49.1 /100 | #177 | Average 17.3% |